VininI_RSI_FO
Download script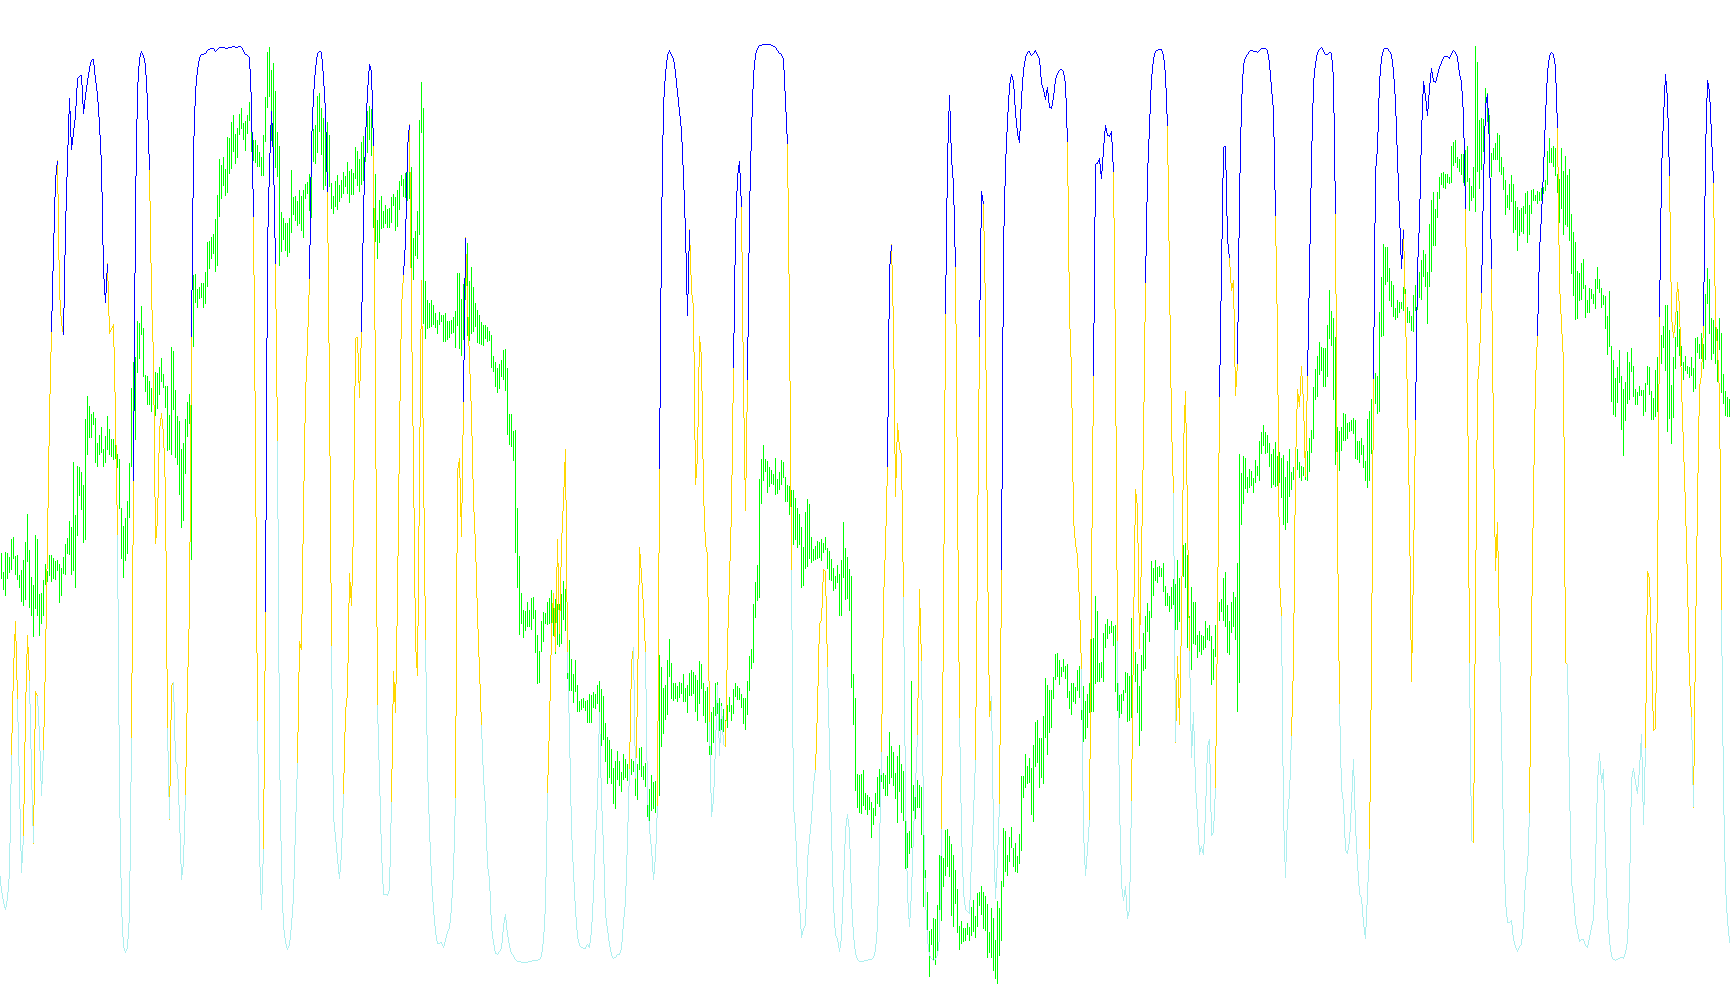
The VininI_Cyber tool is a custom technical indicator designed for the MetaTrader platform to help traders visualize market momentum and identify potential entry points by filtering out "noise" from standard price movements. Instead of plotting directly on the main price chart, it operates in a separate window, providing a smoothed perspective of market sentiment.
How the Logic Works
The indicator functions through a multi-layered calculation process that transforms raw price data into actionable visual signals:
1. Base Momentum Calculation The logic begins by analyzing the Relative Strength Index (RSI)—a standard momentum oscillator. However, instead of using the raw RSI values, the script normalizes the data by centering it around a baseline. This adjustment helps the indicator focus on the intensity of price movement relative to a neutral midpoint.
2. Signal Smoothing (Moving Average) To prevent the indicator from reacting too aggressively to minor, erratic price fluctuations, the script applies a Moving Average to the normalized momentum data. This "smooths out" the lines, ensuring that the visual output reflects sustained trends rather than temporary spikes.
3. Exponential Transformation The core logic employs a mathematical transformation (a hyperbolic tangent-style calculation) on the smoothed data. This process maps the momentum values into a specific range, making it easier to distinguish between strong bullish (upward) and bearish (downward) pressure.
4. Buy and Sell Signal Generation The final output is divided into three distinct visual components based on specific thresholds:
- Momentum Tracking: A primary line tracks the smoothed momentum of the market.
- Buy Signals: When the calculated momentum exceeds a positive threshold (0.5), the indicator highlights the strength of the upward trend.
- Sell Signals: When the momentum drops below a negative threshold (-0.5), the indicator highlights the strength of the downward trend.
Summary for Traders
Essentially, this script acts as a high-pass filter. It takes standard market momentum, removes the "jitter" through smoothing and mathematical scaling, and then isolates clear bullish and bearish zones. This allows traders to see clearly where the underlying trend is gaining significant strength or facing a breakdown, providing a cleaner visual representation of market direction than many standard indicators.
//+------------------------------------------------------------------+
//|                                                     VininI_Cyber |
//|                                Copyright © 2009, Victor Nicolaev |
//|                                            e-mail: vinin@mail.ru |
//+------------------------------------------------------------------+
#property copyright "Copyright © 2008, Victor Nicolaev"
#property link      "e-mail: vinin@mail.ru"

#property indicator_separate_window
#property indicator_buffers 3
#property indicator_color1 Yellow
#property indicator_color2 Lime
#property indicator_color3 Red
#property indicator_level1  -0.5
#property indicator_level2   0
#property indicator_level3   0.5
#property indicator_minimum -1.05
#property indicator_maximum  1.05

//---- input parameters

extern int  RSI_Period=5;
extern int  RSI_Price =0;
extern int  MA_Period =9;
extern int  MA_Method =3;
//---- buffers

double Value[];
double MA[];
double iFish[];
double Buy[];
double Sell[];


//+------------------------------------------------------------------+
//| Custom indicator initialization function |
//+------------------------------------------------------------------+
int init() {
   IndicatorBuffers(5);
   SetIndexBuffer(0, iFish);
   SetIndexStyle(0,DRAW_LINE);
   SetIndexBuffer(1, Buy);
   SetIndexStyle(1,DRAW_LINE);
   SetIndexBuffer(2, Sell);
   SetIndexStyle(2,DRAW_LINE);

   SetIndexBuffer(3, Value);
   SetIndexBuffer(4, MA);


   return(0);
}

int deinit() { return(0); }


//+------------------------------------------------------------------+
//| Custom indicator iteration function |
//+------------------------------------------------------------------+
int start() {
   int counted_bars = IndicatorCounted(), i;

   if (counted_bars < 0) return(-1);
   if (counted_bars > 0) counted_bars--;

   int limit=Bars - counted_bars;
   for(i = limit; i >= 0; i--)    Value[i]=0.1*(iRSI(NULL,0,RSI_Period,RSI_Price,i)-50.0);
   for(i = limit; i >= 0; i--)    MA[i]=iMAOnArray(Value,0,MA_Period,0,MA_Method,i);
   for(i = limit; i >= 0; i--)    {
      iFish[i]=(MathExp(2.0*MA[i])-1.0)/(MathExp(2.0*MA[i])+1.0);
      if (iFish[i]> 0.5) {Buy[i] =iFish[i]; Buy[i+1] =iFish[i+1];}
      if (iFish[i]<-0.5) {Sell[i]=iFish[i]; Sell[i+1]=iFish[i+1];}
   }
   return(0);
}
//+------------------------------------------------------------------+
Comments