VQ_bars
Download script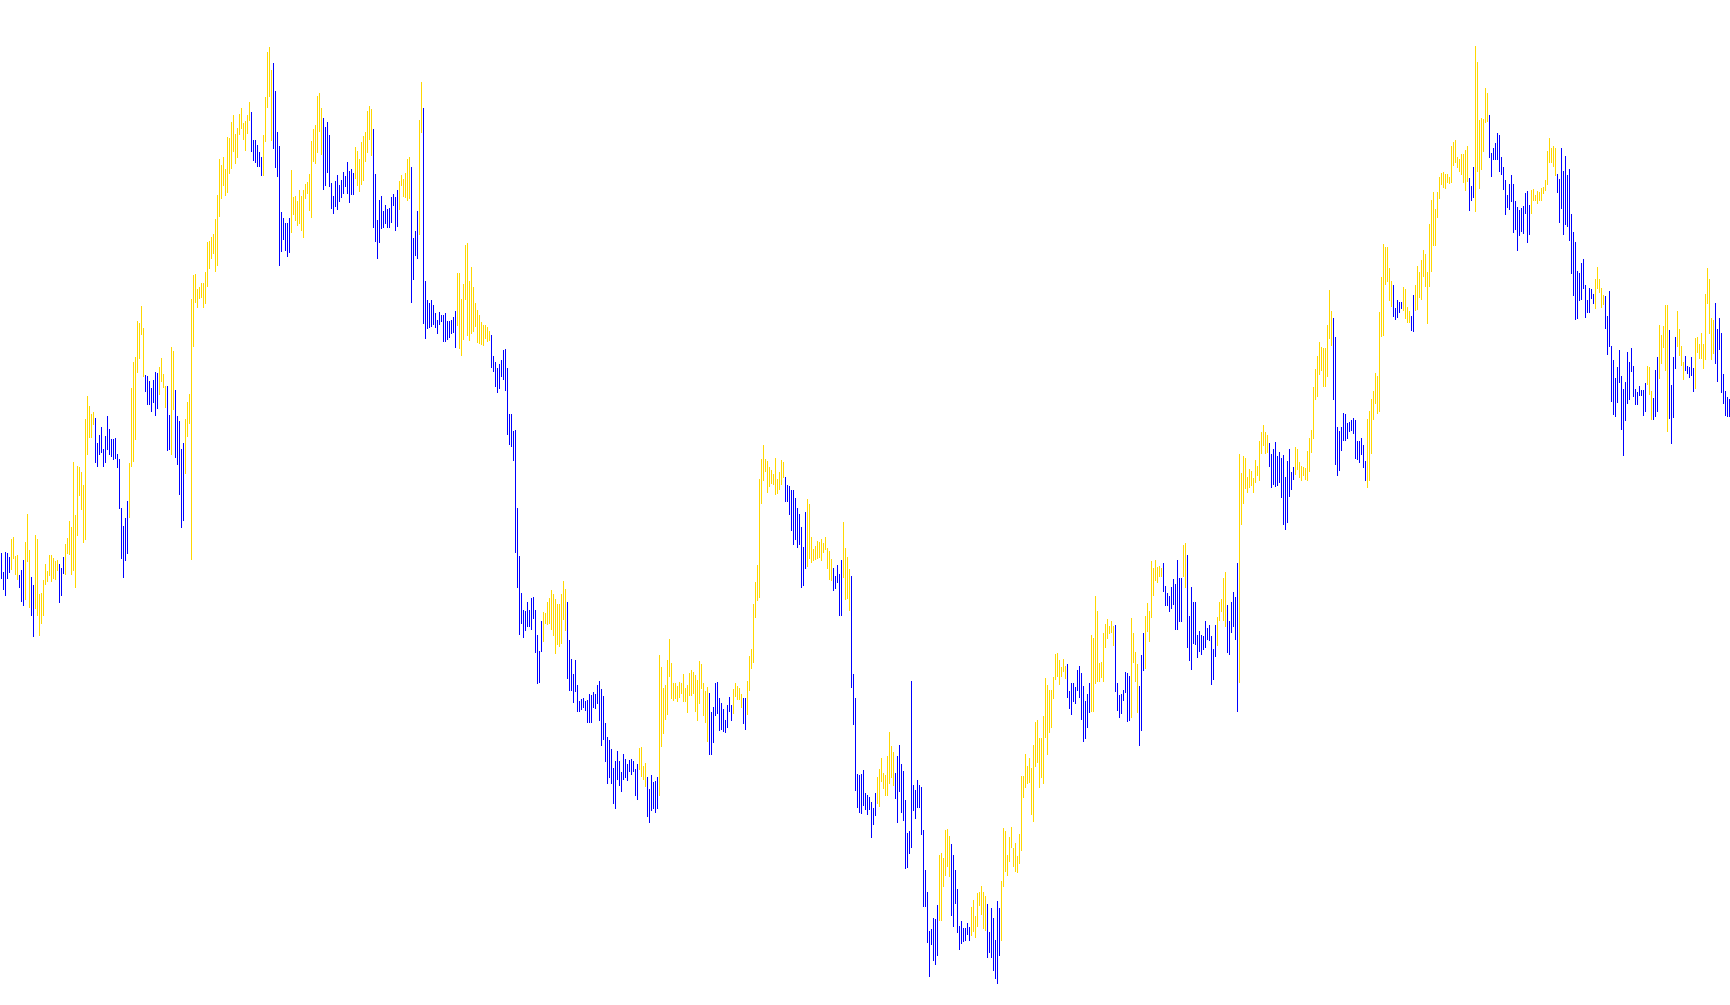
The Volatility Quality (VQ) script is a technical analysis tool designed to interpret market price action by analyzing the relationship between volatility and directional movement. Unlike standard indicators that only look at price alone, this tool evaluates "quality" by measuring how effectively price moves relative to its historical range.
Core Logic and Mechanism
The indicator operates through three primary stages of processing:
1. Price Range Analysis The script begins by calculating a series of averages based on four key price points: the High, Low, Open, and Close of recent candles. It specifically looks at the "spread"—the distance between the highest and lowest prices—to establish a baseline for the market's current volatility.
2. Quality Calculation Once the volatility range is established, the tool calculates a specific "Quality" value. This is done by comparing the current price movement against the maximum possible movement within that period.
- If the price moves significantly in a short amount of time relative to its usual volatility, it is assigned a higher quality score.
- It essentially asks: "Is this move substantial and consistent, or is it just noise?"
3. Accumulation and Filtering The tool doesn't just look at individual moments; it accumulates these quality scores over time to create a running total. To ensure the data remains clean and professional, a "Filter" mechanism is applied. If the change in the accumulated score is too small (meaning the market is moving sideways or erratically), the script ignores that movement to prevent "false signals" from cluttering the visual output.
Visual Interpretation
The final output of this logic is represented on your chart as a directional signal:
- Upward Momentum: When the accumulated quality score is increasing, the indicator identifies an upward trend. This is visually represented by highlighting the high and low prices of the candles in green.
- Downward Momentum: When the accumulated quality score decreases, the indicator identifies a downward trend, which is visually represented in red.
Summary for the User
In simple terms, this script filters out "market noise." It looks for high-quality price movements where the momentum is strong enough to be considered significant relative to recent volatility. By visualizing these trends as green and red highlights, it helps traders identify clear directional shifts while ignoring minor fluctuations that don't have enough "quality" to impact the overall trend.
//+------------------------------------------------------------------+                                                 VQ.mq4 |
//|                                               Volatility Quality |
//|                                                by raff1410@o2.pl |
//+------------------------------------------------------------------+
#property  indicator_chart_window
#property  indicator_buffers 2
#property  indicator_color1  Green
#property  indicator_color2  Red
#property  indicator_width1  2
#property  indicator_width2  2
//----
extern   int      Length=5;
extern   int      Method=3;
extern   int      Smoothing=1;
extern   int      Filter=5;
extern   bool     Steady =false;
//----
double   VQ[];
double   SumVQ[];
double   DIR[];
double   UpBuffer[];
double   DnBuffer[];
//+------------------------------------------------------------------+
int init()
  {
   IndicatorBuffers(5);
   SetIndexStyle(0,DRAW_HISTOGRAM);
   SetIndexBuffer(0,UpBuffer);
   SetIndexStyle(1,DRAW_HISTOGRAM);
   SetIndexBuffer(1,DnBuffer);
   SetIndexBuffer(2,SumVQ);
   SetIndexBuffer(3,VQ);
   SetIndexBuffer(4,DIR);
//----
   if (Length < 2) Length=2;
   if (Method < 0) Method=0;
   if (Method > 3) Method=3;
   if (Smoothing < 0) Smoothing=0;
   if (Filter < 0) Filter=0;
//----
   string short_name="VQ | "+ Length + " , " +
   Method + " , " + Smoothing + " , " + Filter + "  | ";
   IndicatorShortName(short_name);
   SetIndexEmptyValue(0, 0.0);
   SetIndexEmptyValue(1, 0.0);
   SetIndexEmptyValue(2, 0.0);
   SetIndexEmptyValue(3, 0.0);
   return(0);
  }
//+------------------------------------------------------------------+
int start()
  {
   double MH=0, ML=0, MO=0, MC=0, MC1=0;
   int i, j, limit, counted_bars=IndicatorCounted();
//---- check for possible errors
   if(counted_bars<0) return(-1);
//---- last counted bar will be recounted
   if(counted_bars>0) counted_bars--;
//----
   if(counted_bars<1) i=Bars-Length-1;
   else i=Bars-counted_bars;
   if(counted_bars<1)
     {
      j=Bars-Length-1;
      SumVQ[j + 1]=Close[j + 1];
     }
   while(i>=0)
     {
      MH=iMA(NULL,0,Length,0,Method,PRICE_HIGH,i);
      ML=iMA(NULL,0,Length,0,Method,PRICE_LOW,i);
      MO=iMA(NULL,0,Length,0,Method,PRICE_OPEN,i);
      MC=iMA(NULL,0,Length,0,Method,PRICE_CLOSE,i);
      MC1=iMA(NULL,0,Length,0,Method,PRICE_CLOSE,i+Smoothing);
      if (Steady==true)
        {
         MC=iMA(NULL,0,Length,0,Method,PRICE_MEDIAN,i);
         MC1=iMA(NULL,0,Length,0,Method,PRICE_MEDIAN,i+Smoothing);
        }
      if((MH - ML)>0) VQ[i]=MathAbs(((MC - MC1)/MathMax(MH - ML, MathMax(MH - MC1, MC1 - ML)) + (MC - MO)/(MH - ML)) * 0.5) * ((MC - MC1 + (MC - MO)) * 0.5);
      SumVQ[i]=SumVQ[i + 1] + VQ[i];
      if (Filter > 0) if (MathAbs(SumVQ[i] - SumVQ[i + 1]) < Filter * Point) SumVQ[i]=SumVQ[i + 1];
      i--;
     }
   if(counted_bars<1) limit=Bars-Length-1;
   else limit=Bars-counted_bars;
   for(i=limit-1; i>=0; i--)
     {
      if (SumVQ[i] > SumVQ[i+1]) DIR[i]=1;
      if (SumVQ[i] < SumVQ[i+1]) DIR[i]=-1;
      if (SumVQ[i]== SumVQ[i+1]) DIR[i]=DIR[i + 1];
      if (DIR[i] > 0)
        {
         UpBuffer[i]=High[i];
         DnBuffer[i]=Low[i];
        }
      else
         if (DIR[i] < 0)
           {
            DnBuffer[i]=High[i];
            UpBuffer[i]=Low[i];
           }
     }
//----
   return(0);
  }
//+------------------------------------------------------------------+
Comments