VSA_Histogram
Download script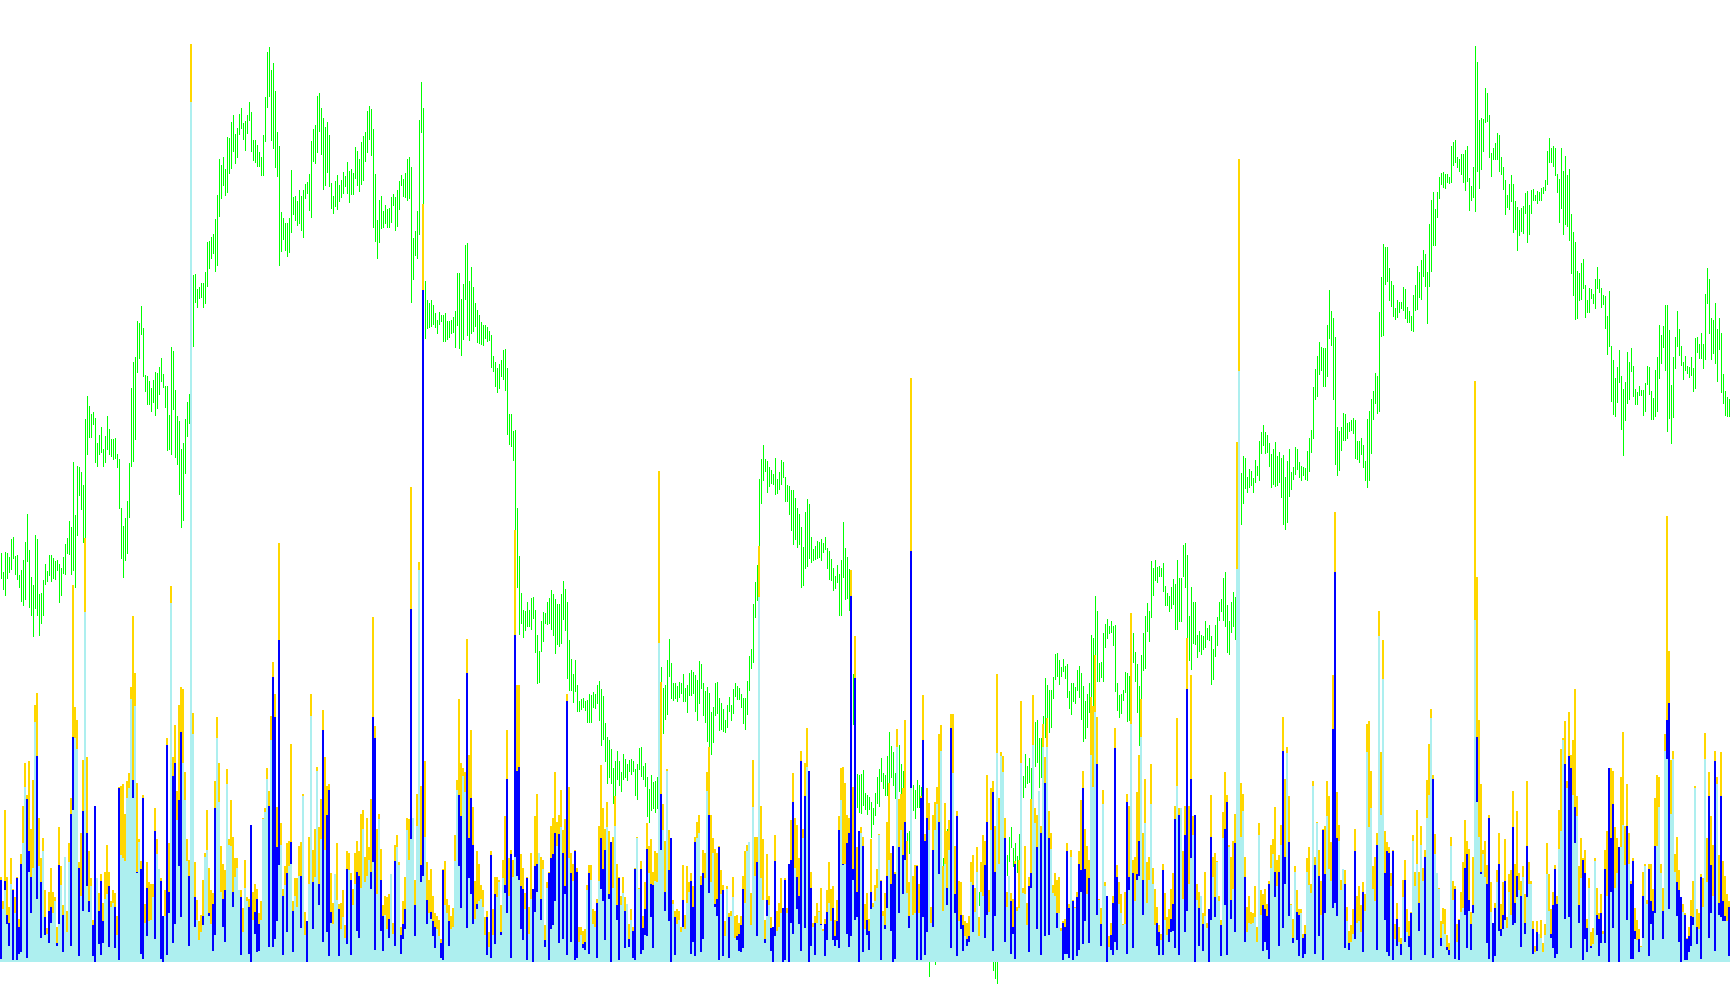
The VSA Histogram is a specialized technical analysis tool designed to provide traders with a visual representation of price action dynamics. Unlike standard price charts that focus solely on where the market is going, this indicator focuses on "how" it is moving by calculating the relationship between the highest and lowest prices achieved during specific timeframes.
How the Logic Works
The core functionality of this script revolves around three distinct measurements, each represented as a separate bar in a histogram window below your main price chart. By analyzing these three components, the tool helps you visualize the intensity of market volatility and the positioning of the closing price relative to the day's range.
1. High-to-Low Range (Market Volatility)
The first component of the histogram measures the total distance between the highest point and the lowest point reached during a specific period. This tells you the overall "territory" covered by the market. A larger bar here indicates a high degree of volatility or a wide range of price discovery, while a smaller bar suggests consolidation or a tight trading range.
2. High-to-Close Relationship (Upper Price Pressure)
The second component measures the distance between the highest point reached and the final closing price of that period. This is crucial for understanding "buying exhaustion" or "selling pressure." For example, if the market reaches a very high peak but closes significantly lower, it suggests that buyers were unable to sustain the higher prices, potentially indicating a lack of demand.
3. Relative Positioning (The Spread)
The third component simplifies the relationship between the previous two. It calculates the specific "spread" or remaining distance based on where the price ended compared to its full range. This serves as a refined metric to see where the market "settled." By looking at this, you can determine if the price closed near the top of its range (strong bullish sentiment), near the bottom (strong bearish sentiment), or in the middle (neutral/indecisive sentiment).
Key Features
- Multi-Timeframe Compatibility: The tool is designed to be flexible. You can configure it to monitor various timeframes—ranging from 1-minute charts to monthly data—allowing you to view broader market trends while staying on a lower-resolution chart.
- Visual Clarity: By using three distinct colors (Lime, Red, and Orange), the histogram provides an immediate visual cue. It separates the total range, the upper price action, and the relative spread into easy-to-read data points.
- Automated Scaling: The script includes internal logic to automatically adjust its calculations based on your broker's pricing (such as 3-digit or 5-digit quotes), ensuring that the histogram remains accurate and readable regardless of the asset you are trading.
In summary, this tool acts as a "sentiment thermometer." It moves beyond simple price movement to show you the underlying intensity of the market, helping you identify whether buyers or sellers are currently in control based on how much ground was covered and where the price eventually landed.
//+------------------------------------------------------------------+
//|                                                VSA HISTOGRAM.mq4 |
//|                                    Copyright (c) 2009, FOREXflash. |
//|                                        http://www.metaquotes.net |
//+------------------------------------------------------------------+
#property copyright "Copyright (c) 2009, FOREXflash Software"
#property link      "http://www.metaquotes.net"

#property indicator_separate_window
#property indicator_buffers 3
#property indicator_color1 Lime
#property indicator_color2 Red
#property indicator_color3 Orange


extern int  TimeFrame=0;

double ExtMapBuffer1[];
double ExtMapBuffer2[];
double ExtMapBuffer3[];

datetime timeh = 0,timel = 0, timeo = 0, timec = 0, once = 0;
double Mult = 1;

//+------------------------------------------------------------------+
//| Custom indicator initialization function                         |
//+------------------------------------------------------------------+
int init()
  {

//---- indicator line
   if ( Digits == 5 || Digits == 3 )
        Mult = 10;

   switch(TimeFrame)
   {
      case 1 : string TimeFrameStr="Period_M1"; break;
      case 5 : TimeFrameStr="Period_M5"; break;
      case 15 : TimeFrameStr="Period_M15"; break;
      case 30 : TimeFrameStr="Period_M30"; break;
      case 60 : TimeFrameStr="Period_H1"; break;
      case 240 : TimeFrameStr="Period_H4"; break;
      case 1440 : TimeFrameStr="Period_D1"; break;
      case 10080 : TimeFrameStr="Period_W1"; break;
      case 43200 : TimeFrameStr="Period_MN1"; break;
      default : TimeFrameStr=" MTF";
   }


   SetIndexBuffer(0,ExtMapBuffer1);
   SetIndexStyle(0,DRAW_HISTOGRAM, STYLE_SOLID, 3);
   SetIndexDrawBegin(0,3);
   SetIndexLabel(0,TimeFrameStr+"  H\L:");
   SetIndexBuffer(1,ExtMapBuffer2);
   SetIndexStyle(1,DRAW_HISTOGRAM, STYLE_SOLID, 3);
   SetIndexDrawBegin(1,3);
   SetIndexLabel(1,TimeFrameStr+"  H\C:");
   SetIndexBuffer(2,ExtMapBuffer3);
   SetIndexStyle(2,DRAW_HISTOGRAM, STYLE_SOLID, 3);
   SetIndexDrawBegin(2,3);
   SetIndexLabel(2,TimeFrameStr+"  SPREAD:");

   IndicatorShortName("VSA HISTOGRAM"+TimeFrameStr);

   return(0);
  }

//+------------------------------------------------------------------+
//| Custor indicator deinitialization function                       |
//+------------------------------------------------------------------+
int deinit()
  {
  Comment("");

  return(0);
}
//+------------------------------------------------------------------+
//| Custom indicator iteration function                              |
//+------------------------------------------------------------------+
int start()
  {

   datetime TimeArray[];
   int    i,shift,limit,y=0,counted_bars=IndicatorCounted();
   string on;

   ArrayCopySeries(TimeArray,MODE_TIME,Symbol(),TimeFrame);

   limit=Bars-counted_bars+TimeFrame/Period();
   for(i=0,y=0;i<limit;i++)
   {
   if (Time[i]<TimeArray[y]) y++;
   ExtMapBuffer1[i] = EMPTY_VALUE; ExtMapBuffer2[i] = EMPTY_VALUE; ExtMapBuffer3[i] = EMPTY_VALUE;


   ExtMapBuffer1[i] = iHigh(NULL,TimeFrame,y)-iLow(NULL,TimeFrame,y);
      {
      }
   ExtMapBuffer2[i] = iHigh(NULL,TimeFrame,y)-iClose(NULL,TimeFrame,y);
      {
      }
   ExtMapBuffer3[i] = (iHigh(NULL,TimeFrame,y)-iLow(NULL,TimeFrame,y))-(iHigh(NULL,TimeFrame,y)-iClose(NULL,TimeFrame,y));
      {
      }
    }
  return(0);
}
//+------------------------------------------------------------------+
Comments