Waddah Attar RSI Level
Download script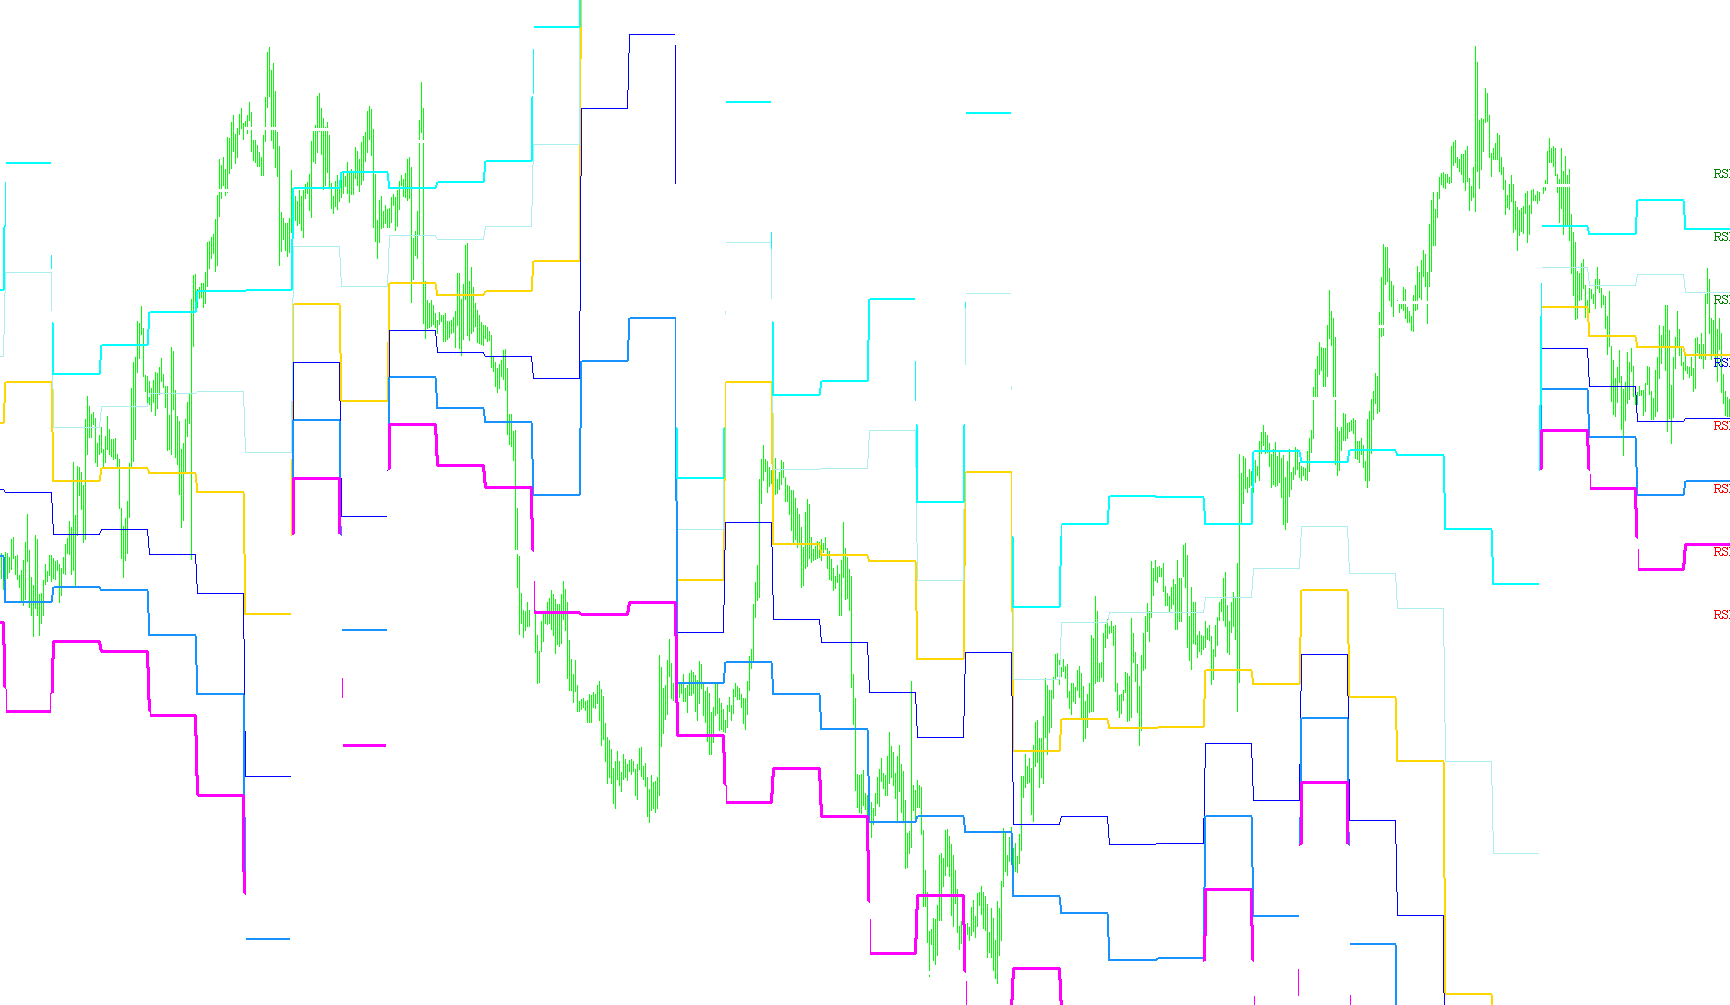
The Waddah Attar RSI Level tool is designed to provide traders with a visual representation of specific momentum thresholds directly on their price charts. Instead of forcing you to look at a separate sub-window to check the Relative Strength Index (RSI), this script projects key RSI levels—such as 20, 30, 40, 50, 60, 70, 80, and 90—onto the actual price action.
Core Logic and Functionality
1. Multi-Timeframe Analysis The tool is specifically programmed to calculate data based on Daily (D1) timeframes. This means that regardless of what smaller timeframe you are currently viewing on your chart (like 15-minute or 1-hour charts), the levels displayed will remain consistent with the overarching daily momentum.
2. Dynamic Price Projection The primary logic involves translating a "momentum value" into a "price value." Since standard RSI values exist on a scale of 0 to 100, they don't normally appear on a price chart. This script solves that by calculating the mathematical relationship between:
- The recent change in the RSI value.
- The corresponding change in actual market price.
By analyzing these two movements simultaneously, the tool "projects" where specific RSI milestones (like the 50-level equilibrium or the 70-level overbought area) would occur on the current price chart.
3. Visual Identification of Key Zones The script automatically identifies and draws several critical price levels:
- Equilibrium (RSI 50): Shown in blue, this acts as a primary pivot point to determine the balance between bullish and bearish momentum.
- Overbought/Oversold Regions: It plots various thresholds (20, 30, 40, 60, 70, 80, and an adjustable "Extra Level" like 90) using alternating colors. These provide a visual map of where the market might be reaching extremes.
4. Real-Time Dynamic Updates As the market moves and new price data is received, the script recalculates these projections in real-time. It creates and updates text labels and price markers on your chart so that you can see exactly what the RSI levels are doing relative to the current candle prices at any given moment.
Summary for the User
In simple terms, this tool acts as a "bridge." It takes the data from the RSI indicator—which usually tells you how strong a trend is—and translates it into where those strengths are happening on your price chart. This allows for a more integrated trading experience where momentum and price action are viewed as a single, unified picture.
//+------------------------------------------------------------------+
//|                          Waddah Attar RSI Level ..Idea by Yamedo |
//|                              Copyright © 2007, www.metaforex.net |
//|                                   Waddah Attar www.metaforex.net |
//+------------------------------------------------------------------+
#property copyright "Copyright © 2007, www.metaforex.net"
#property link      "www.metaforex.net"
//----
#property indicator_chart_window
#property indicator_buffers 8
#property indicator_color1 Blue
#property indicator_color2 Red
#property indicator_color3 Green
#property indicator_color4 Red
#property indicator_color5 Green
#property indicator_color6 Red
#property indicator_color7 Green
#property indicator_color8 Magenta
//----
extern int RSIDayPeriod = 5;
extern int ExtraLevel = 10;
//---- buffers
double P1Buffer[];
double P2Buffer[];
double P3Buffer[];
double P4Buffer[];
double P5Buffer[];
double P6Buffer[];
double P7Buffer[];
double P8Buffer[];
//----
int myPeriod = PERIOD_D1;
//----
double L90, L80, L70, L60, L50, L40, L30, L20;
//+------------------------------------------------------------------+
//| Custom indicator initialization function                         |
//+------------------------------------------------------------------+
int init()
  {
   SetIndexBuffer(0, P1Buffer);
   SetIndexBuffer(1, P2Buffer);
   SetIndexBuffer(2, P3Buffer);
   SetIndexBuffer(3, P4Buffer);
   SetIndexBuffer(4, P5Buffer);
   SetIndexBuffer(5, P6Buffer);
   SetIndexBuffer(6, P7Buffer);
   SetIndexBuffer(7, P8Buffer);
//----
   SetIndexStyle(0, DRAW_LINE, STYLE_SOLID, 2);
   SetIndexStyle(1, DRAW_LINE, STYLE_SOLID, 1);
   SetIndexStyle(2, DRAW_LINE, STYLE_SOLID, 1);
   SetIndexStyle(3, DRAW_LINE, STYLE_SOLID, 2);
   SetIndexStyle(4, DRAW_LINE, STYLE_SOLID, 2);
   SetIndexStyle(5, DRAW_LINE, STYLE_SOLID, 3);
   SetIndexStyle(6, DRAW_LINE, STYLE_SOLID, 3);
   SetIndexStyle(7, DRAW_LINE, STYLE_SOLID, 4);
//----
   Comment("RSI ( " + RSIDayPeriod + " ) Level By eng.Waddah Attar www.metaforex.net");
   return(0);
  }
//+------------------------------------------------------------------+
//| Custor indicator deinitialization function                       |
//+------------------------------------------------------------------+
int deinit()
  {
   ObjectDelete("rsi20" + DoubleToStr(RSIDayPeriod, 0));
   ObjectDelete("txtrsi20" + DoubleToStr(RSIDayPeriod, 0));
   ObjectDelete("rsi30" + DoubleToStr(RSIDayPeriod, 0));
   ObjectDelete("txtrsi30" + DoubleToStr(RSIDayPeriod, 0));
   ObjectDelete("rsi40" + DoubleToStr(RSIDayPeriod, 0));
   ObjectDelete("txtrsi40" + DoubleToStr(RSIDayPeriod, 0));
   ObjectDelete("rsi50" + DoubleToStr(RSIDayPeriod, 0));
   ObjectDelete("txtrsi50" + DoubleToStr(RSIDayPeriod, 0));
   ObjectDelete("rsi60" + DoubleToStr(RSIDayPeriod, 0));
   ObjectDelete("txtrsi60" + DoubleToStr(RSIDayPeriod, 0));
   ObjectDelete("rsi70" + DoubleToStr(RSIDayPeriod, 0));
   ObjectDelete("txtrsi70" + DoubleToStr(RSIDayPeriod, 0));
   ObjectDelete("rsi80" + DoubleToStr(RSIDayPeriod, 0));
   ObjectDelete("txtrsi80" + DoubleToStr(RSIDayPeriod, 0));
   ObjectDelete("rsi90" + DoubleToStr(RSIDayPeriod, 0));
   ObjectDelete("txtrsi90" + DoubleToStr(RSIDayPeriod, 0));
//----
   Comment("");
   return(0);
  }
//+------------------------------------------------------------------+
//| Custom indicator iteration function                              |
//+------------------------------------------------------------------+
int start()
  {
   int i, dayi, counted_bars = IndicatorCounted();
   double rsi1, rsi2, c1, c2, drsi, dc;
//---- check for possible errors
   if(counted_bars < 0)
       return(-1);
//---- last counted bar will be recounted
   if(counted_bars > 0)
       counted_bars--;
   int limit = Bars - counted_bars;
//----
   for(i = limit - 1; i >= 0; i--)
     {
       dayi = iBarShift(Symbol(), myPeriod, Time[i],true);
       if(dayi != -1)
         {
           rsi1 = iRSI(Symbol(), PERIOD_D1, RSIDayPeriod, PRICE_CLOSE, dayi + 1);
           rsi2 = iRSI(Symbol(), PERIOD_D1, RSIDayPeriod, PRICE_CLOSE, dayi + 2);
           //----
           c1 = iClose(Symbol(), PERIOD_D1, dayi + 1);
           c2 = iClose(Symbol(), PERIOD_D1, dayi + 2);
           //----
           drsi = rsi1 - rsi2;
           //----
           if(drsi == 0)
             {
               rsi2 = iRSI(Symbol(), PERIOD_D1, RSIDayPeriod, PRICE_CLOSE, dayi + 3);
             }
           //----
           drsi = rsi1 - rsi2;
           //----
           if(drsi == 0)
             {
               drsi = rsi1;
             }
           //----
           dc = c1 - c2;
           //----
           if(dc == 0)
             {
               c2 = iClose(Symbol(), PERIOD_D1, dayi + 3);
             }
           //----
           dc = c1 - c2;
           //----
           if(dc == 0)
             {
               dc = c1;
             }
           //----
           L90 = (((ExtraLevel - rsi1)*dc) / drsi) + c1;
           P8Buffer[i] = L90;
           SetPrice("rsi90" + DoubleToStr(RSIDayPeriod, 0), Time[i],
                    L90, Red);
           SetText("txtrsi90" + DoubleToStr(RSIDayPeriod, 0), "RSI " +
                   DoubleToStr(ExtraLevel, 0), Time[i], L90, Red);
           //----
           L50 = (((50 - rsi1)*dc) / drsi) + c1;
           P1Buffer[i] = L50;
           SetPrice("rsi50" + DoubleToStr(RSIDayPeriod, 0), Time[i],
                    L50, Blue);
           SetText("txtrsi50" + DoubleToStr(RSIDayPeriod, 0), "RSI 50",
                   Time[i], L50, Blue);
           //---
           L40=(((40 - rsi1)*dc) / drsi) + c1;
           P2Buffer[i] = L40;
           SetPrice("rsi40" + DoubleToStr(RSIDayPeriod, 0), Time[i],
                    L40, Red);
           SetText("txtrsi40" + DoubleToStr(RSIDayPeriod, 0), "RSI 40",
                   Time[i], L40, Red);
           //----
           L60 = (((60 - rsi1)*dc) / drsi) + c1;
           P3Buffer[i] = L60;
           SetPrice("rsi60" + DoubleToStr(RSIDayPeriod, 0), Time[i],
                    L60, Green);
           SetText("txtrsi60" + DoubleToStr(RSIDayPeriod, 0), "RSI 60",
                    Time[i], L60, Green);
           //----
           L30 = (((30 - rsi1)*dc) / drsi) + c1;
           P4Buffer[i] = L30;
           SetPrice("rsi30" + DoubleToStr(RSIDayPeriod, 0), Time[i],
                    L30, Red);
           SetText("txtrsi30" + DoubleToStr(RSIDayPeriod, 0), "RSI 30",
                   Time[i], L30, Red);
           //----
           L70 = (((70 - rsi1)*dc) / drsi) + c1;
           P5Buffer[i] = L70;
           SetPrice("rsi70" + DoubleToStr(RSIDayPeriod, 0), Time[i],
                    L70, Green);
           SetText("txtrsi70" + DoubleToStr(RSIDayPeriod, 0), "RSI 70",
                   Time[i], L70, Green);
           //----
           L20 = (((20 - rsi1)*dc) / drsi) + c1;
           P6Buffer[i] = L20;
           SetPrice("rsi20" + DoubleToStr(RSIDayPeriod, 0), Time[i],
                    L20, Red);
           SetText("txtrsi20" + DoubleToStr(RSIDayPeriod, 0), "RSI 20",
                   Time[i], L20, Red);
           //----
           L80 = (((80 - rsi1)*dc) / drsi) + c1;
           P7Buffer[i] = L80;
           SetPrice("rsi80" + DoubleToStr(RSIDayPeriod, 0), Time[i],
                    L80, Green);
           SetText("txtrsi80" + DoubleToStr(RSIDayPeriod, 0), "RSI 80",
                   Time[i], L80, Green);
        }
     }
//----
   return(0);
  }
//+------------------------------------------------------------------+
//|                                                                  |
//+------------------------------------------------------------------+
void SetPrice(string name, datetime Tm, double Prc, color clr)
  {
   if(ObjectFind(name) == -1)
     {
       ObjectCreate(name, OBJ_ARROW, 0, Tm, Prc);
       ObjectSet(name, OBJPROP_COLOR, clr);
       ObjectSet(name, OBJPROP_WIDTH, 1);
       ObjectSet(name, OBJPROP_ARROWCODE, SYMBOL_RIGHTPRICE);
     }
   else
     {
       ObjectSet(name, OBJPROP_TIME1, Tm);
       ObjectSet(name, OBJPROP_PRICE1, Prc);
       ObjectSet(name, OBJPROP_COLOR, clr);
       ObjectSet(name, OBJPROP_WIDTH, 1);
       ObjectSet(name, OBJPROP_ARROWCODE, SYMBOL_RIGHTPRICE);
     }
  }
//+------------------------------------------------------------------+
//|                                                                  |
//+------------------------------------------------------------------+
void SetText(string name,string txt,datetime Tm,double Prc,color clr)
  {
   if(ObjectFind(name) == -1)
     {
       ObjectCreate(name, OBJ_TEXT, 0, Tm, Prc);
       ObjectSetText(name, txt, 10, "Times New Roman", clr);
       ObjectSet(name, OBJPROP_CORNER, 2);
     }
   else
     {
       ObjectSet(name, OBJPROP_TIME1, Tm);
       ObjectSet(name, OBJPROP_PRICE1, Prc);
       ObjectSetText(name, txt, 10, "Times New Roman", clr);
       ObjectSet(name, OBJPROP_CORNER, 2);
     }
  }
//+------------------------------------------------------------------+
Comments