Weekly_HILO_Shj_close
Download script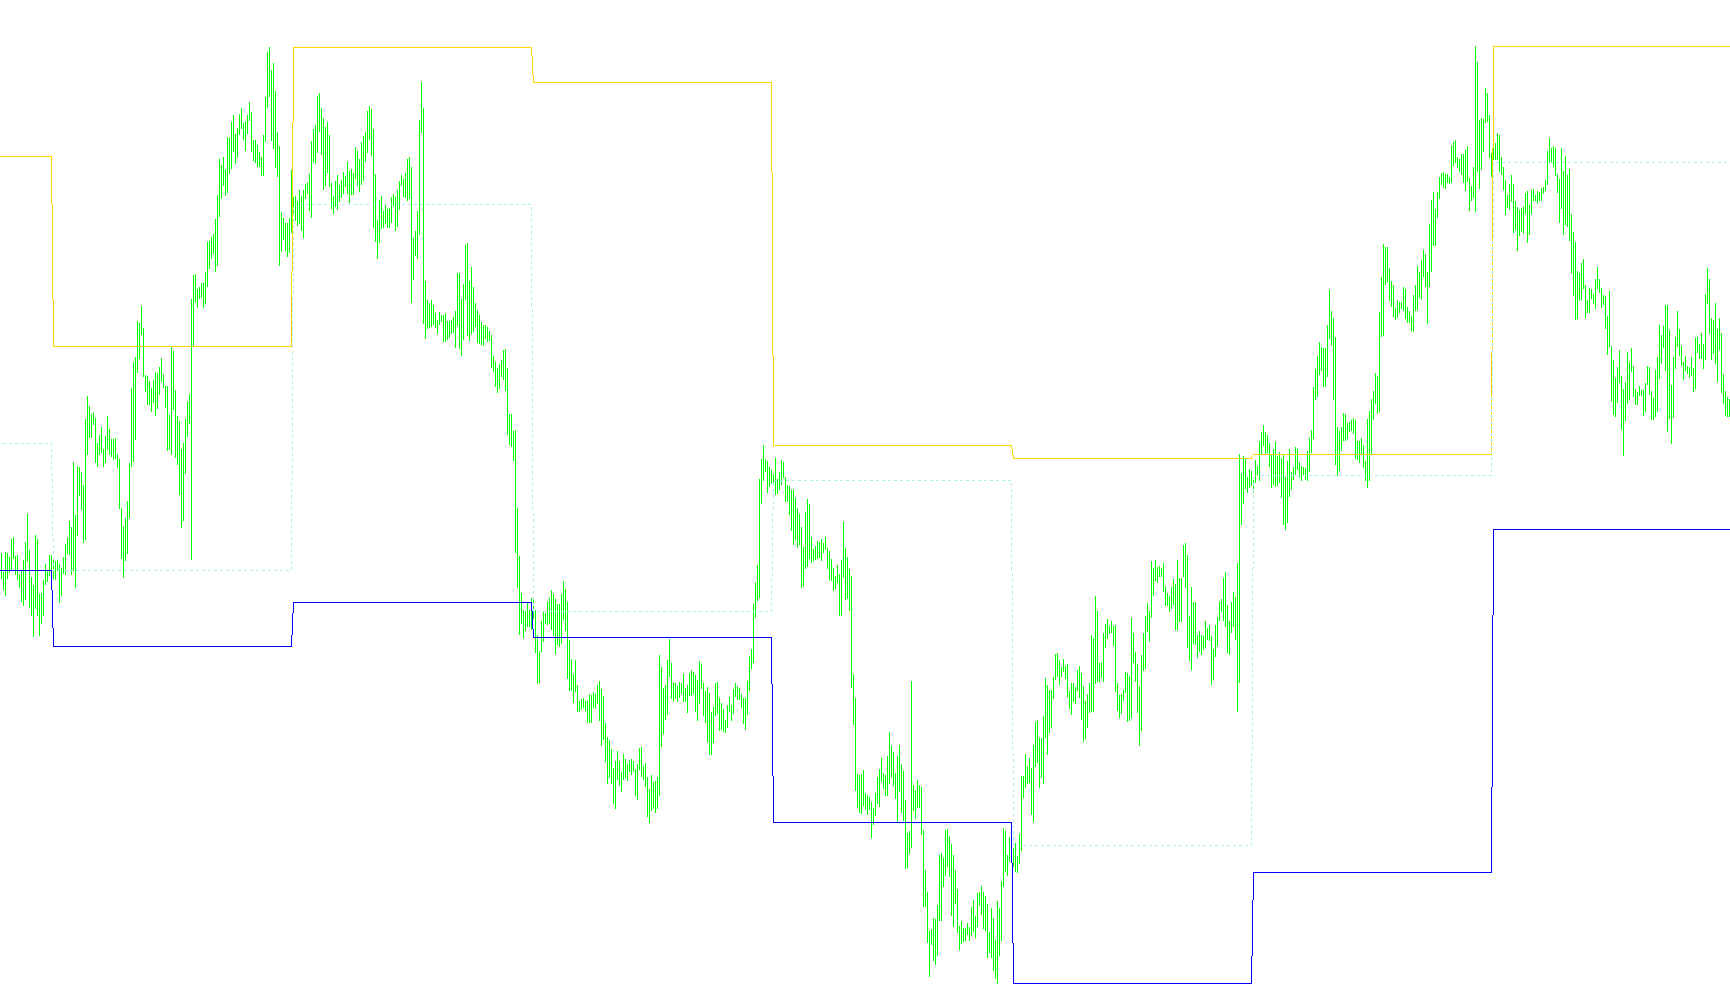
This tool is designed for traders who use historical price action to identify key support and resistance levels. Its primary purpose is to automatically calculate and plot three specific price points from the previous week onto your current trading chart, allowing you to visualize where the market moved in the past and how it might react today.
How the Logic Works
The script scans your trading history to identify the completion of each weekly cycle. It specifically looks for the transition between days to determine when a new week begins. Once it identifies the end of a week, it captures three vital pieces of information:
- Previous Week High: The highest price reached during the entirety of the previous week.
- Previous Week Low: The lowest price reached during the entirety of the previous week.
- Previous Week Close: The closing price at the end of the previous week.
Visual Representation on Your Chart
Instead of just giving you a single number in a data window, the script draws these levels directly on your chart as horizontal lines and descriptive text labels:
- High Level (Tomato): A line representing the peak of the last week's price action.
- Low Level (DeepSkyBlue): A line representing the bottom of the last week's price action.
- Closing Level (DarkGreen): A dotted line showing exactly where the market finished the previous week.
Dynamic Updates
The logic is designed to be "live." As new candles form and time progresses, the script constantly monitors the current data. When a new week starts, the tool automatically shifts its focus—the data from the week that just finished becomes the "Previous Week" data for your current view, and it begins tracking the highs and lows of the new week to prepare for the next cycle.
Key Features for Users
- Automated Tracking: You don't have to manually find where last week ended; the script does the math for you.
- Clear Labeling: The script includes text labels on the chart (such as "HIGH minggu lalu") so you can immediately identify which line is which without guessing.
- Visual Continuity: By drawing these lines across your current timeframe, it helps you see if the price is currently trading above or below last week's significant boundaries.
/*+------------------------------------------------------------------+
 | FileName:
 | Author: Copyright © 2005,
 | Version : 01 (Inital code)
 |
 +------------------------------------------------------------------+*/
#property copyright "Copyright © 2005, "
#property link      "http://"

#property indicator_chart_window
#property indicator_buffers 3

#property indicator_color1 Tomato
#property indicator_color2 DeepSkyBlue
#property indicator_color3 DarkGreen

#property indicator_width1 2
#property indicator_width2 2

//---- input parameters

//---- buffers

extern int space = 44;

double PrevWeekHiBuffer[];
double PrevWeekLoBuffer[];
double PrevWeekMidBuffer[];

int fontsize=10;
double x;
double PrevWeekHi, PrevWeekLo, LastWeekHi, LastWeekLo,PrevWeekMid;
string Space;

//+------------------------------------------------------------------+
//| Custor indicator deinitialization function                       |
//+------------------------------------------------------------------+
int deinit()
{
   ObjectDelete("PrevWeekHi1");
   ObjectDelete("PrevWeekLo1");
   ObjectDelete("PrevWeekClose");
   return(0);
}

//+------------------------------------------------------------------+
//| Custom indicator initialization function                         |
//+------------------------------------------------------------------+
int init()
{
   string short_name;
   int y;

   SetIndexStyle(0,DRAW_LINE);
   SetIndexStyle(1,DRAW_LINE);
   SetIndexStyle(2,DRAW_LINE, STYLE_DOT);

   SetIndexBuffer(0, PrevWeekHiBuffer);
   SetIndexBuffer(1, PrevWeekLoBuffer);
   SetIndexBuffer(2, PrevWeekMidBuffer);

   short_name="Prev Hi-Lo levels +prevWClose";
   IndicatorShortName(short_name);
   SetIndexLabel(0, short_name);
   SetIndexDrawBegin(0,1);

   for(y=0;y<=space;y++)
   {
      Space = Space+" ";
   }

   return(0);
}

//+------------------------------------------------------------------+
//| Custom indicator iteration function                              |
//+------------------------------------------------------------------+
int start()
{
   int    counted_bars=IndicatorCounted();
   int limit, i;

   if (counted_bars==0)
   {
      x=Period();
      if (x>240) return(-1);
      ObjectCreate("PrevWeekHi1", OBJ_TEXT, 0, 0, 0);
      ObjectSetText("PrevWeekHi1", Space+"HIGH minggu lalu",fontsize,"Arial", Tomato);
      ObjectCreate("PrevWeekLo1", OBJ_TEXT, 0, 0, 0);
      ObjectSetText("PrevWeekLo1", Space+"LOW minggu lalu",fontsize,"Arial", DeepSkyBlue);
      ObjectCreate("PrevWeekClose", OBJ_TEXT, 0, 0, 0);
      ObjectSetText("PrevWeekClose", Space+"prevWeekClose",fontsize,"Arial", DarkGreen);
   }

   limit=(Bars-counted_bars)-1;

   for (i=limit; i>=0;i--)
   {

      if (High[i+1]>LastWeekHi) LastWeekHi = High[i+1];
      if (Low [i+1]<LastWeekLo) LastWeekLo = Low [i+1];

      if (TimeDay(Time[i])!=TimeDay(Time[i+1]))
      {
         if(TimeDayOfWeek(Time[i])==1)
         {
            PrevWeekHi  = LastWeekHi;
            PrevWeekLo  = LastWeekLo;
            LastWeekHi  = Open[i];
            LastWeekLo  = Open[i];
            PrevWeekMid = Close[i+1];
         }
      }


      PrevWeekHiBuffer [i] = PrevWeekHi;
      PrevWeekLoBuffer [i] = PrevWeekLo;
      PrevWeekMidBuffer[i] = PrevWeekMid;

      ObjectMove("PrevWeekHi1" , 0, Time[i], PrevWeekHi);
      ObjectMove("PrevWeekLo1" , 0, Time[i], PrevWeekLo);
      ObjectMove("PrevWeekClose", 0, Time[i], PrevWeekMid);
   }

   return(0);
}
//+------------------------------------------------------------------+
Comments