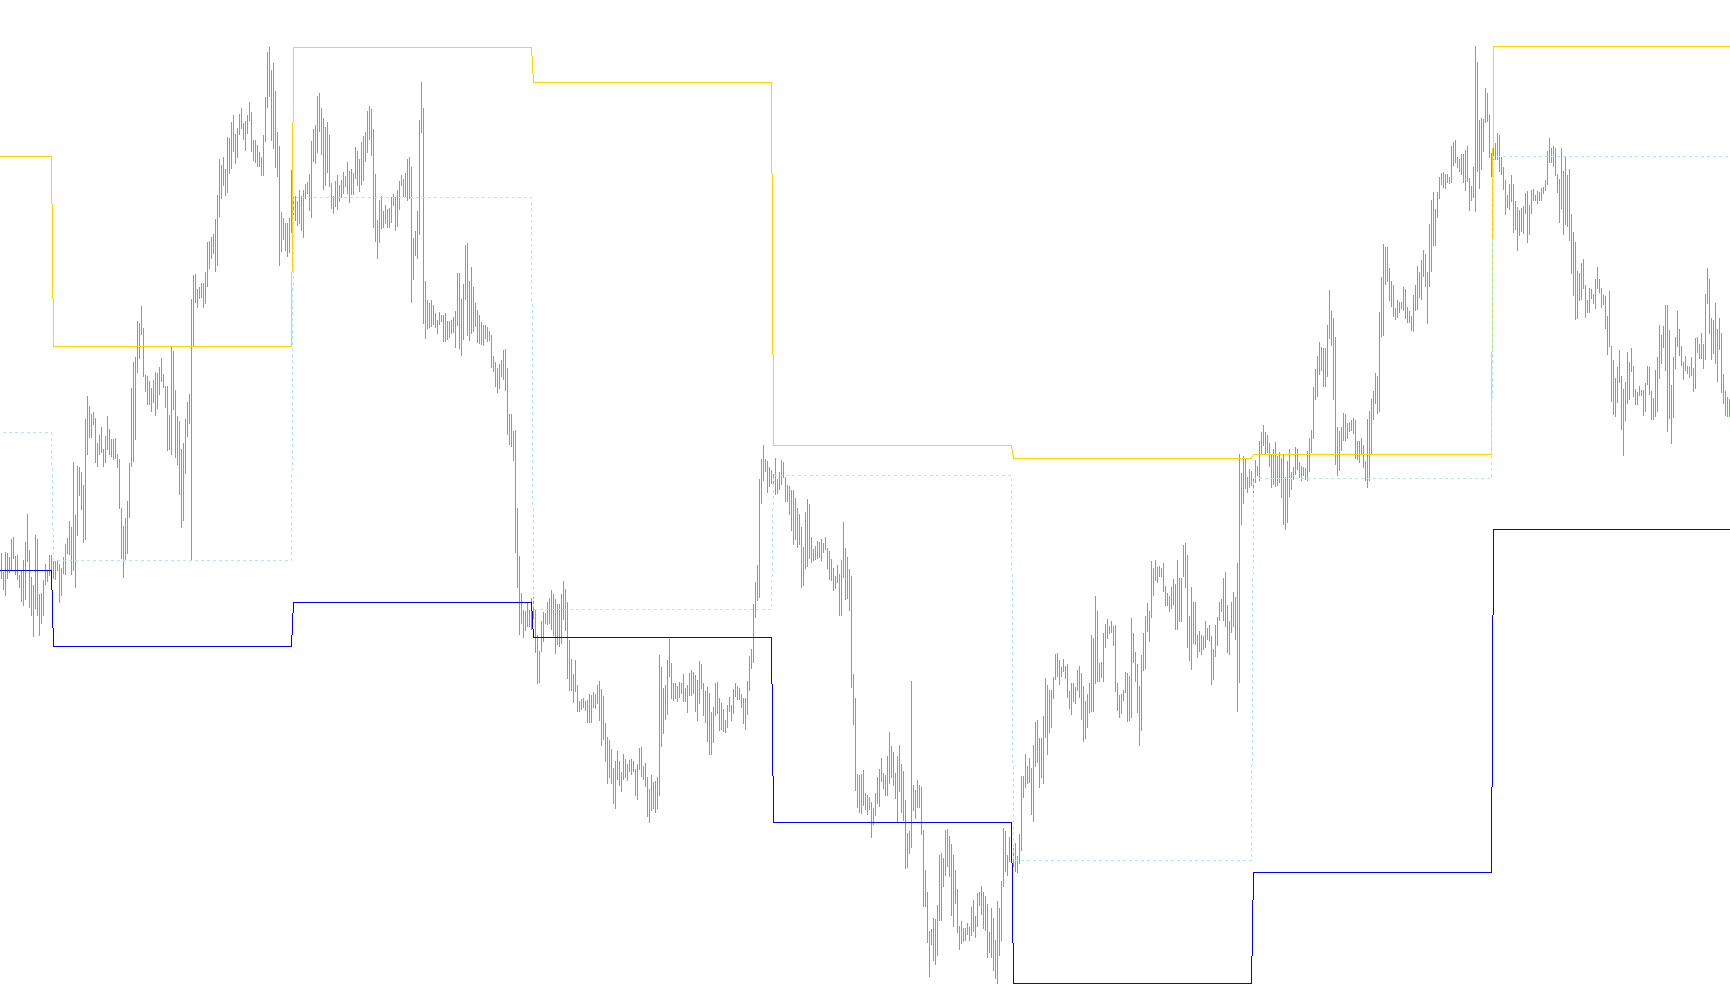
This tool is designed to provide traders with a clear visual representation of key price levels from the previous week. By automatically identifying and plotting these historical benchmarks, it helps you understand where the market reached its highest and lowest points in the preceding seven-day period.
How the Logic Works
The script monitors the historical price data of your chart and performs the following actions:
1. Identification of Weekly Boundaries The tool scans through previous trading sessions to determine the absolute High and Low prices reached during the last full week. It captures these extremes to establish "support" and "resistance" levels based on where the market actually moved previously.
2. Calculation of the Midpoint/Opening Reference In addition to the highs and lows, the script identifies the opening price of the current week (or the previous period depending on the transition). This provides a central reference point, often used by traders to gauge whether the current price is trading above or below the starting sentiment of the week.
3. Dynamic Visual Mapping The script doesn't just show you one single number; it projects these values as horizontal lines across your chart. As new price data comes in, the tool constantly updates these lines so that they remain accurate to the current timeframe.
4. Automatic Labeling To make the chart easy to read at a glance, the script adds descriptive text labels next to the lines. These labels clearly identify which line represents the "Previous Week High," the "Previous Week Low," and the weekly opening reference, ensuring you don't have to guess what each level signifies.
Key Benefits for Your Trading
- Contextual Awareness: Quickly see how the current market price relates to last week's significant peaks and troughs.
- Reduced Manual Work: Instead of manually looking back at historical charts to find previous week's highs and lows, the script does the calculation for you automatically.
- Clean Visualization: The use of distinct colors (Tomato, DeepSkyBlue, and LimeGreen) allows for instant visual differentiation between different types of price levels.
/*+------------------------------------------------------------------+
 | FileName:
 | Author: Copyright © 2005,
 | Version : 01 (Inital code)
 |
 +------------------------------------------------------------------+*/
#property copyright "Copyright © 2005, "
#property link      "http://"

#property indicator_chart_window
#property indicator_buffers 3

#property indicator_color1 Tomato
#property indicator_color2 DeepSkyBlue
#property indicator_color3 LimeGreen

#property indicator_width1 2
#property indicator_width2 2

//---- input parameters

//---- buffers

extern int space = 44;

double PrevWeekHiBuffer[];
double PrevWeekLoBuffer[];
double PrevWeekMidBuffer[];

int fontsize=10;
double x;
double PrevWeekHi, PrevWeekLo, LastWeekHi, LastWeekLo,PrevWeekMid;
string Space;

//+------------------------------------------------------------------+
//| Custor indicator deinitialization function                       |
//+------------------------------------------------------------------+
int deinit()
{
   ObjectDelete("PrevWeekHi");
   ObjectDelete("PrevWeekLo");
   ObjectDelete("PrevWeekMid");
   return(0);
}

//+------------------------------------------------------------------+
//| Custom indicator initialization function                         |
//+------------------------------------------------------------------+
int init()
{
   string short_name;
   int y;

   SetIndexStyle(0,DRAW_LINE);
   SetIndexStyle(1,DRAW_LINE);
   SetIndexStyle(2,DRAW_LINE, STYLE_DOT);

   SetIndexBuffer(0, PrevWeekHiBuffer);
   SetIndexBuffer(1, PrevWeekLoBuffer);
   SetIndexBuffer(2, PrevWeekMidBuffer);

   short_name="Prev Hi-Lo levels";
   IndicatorShortName(short_name);
   SetIndexLabel(0, short_name);
   SetIndexDrawBegin(0,1);

   for(y=0;y<=space;y++)
   {
      Space = Space+" ";
   }

   return(0);
}

//+------------------------------------------------------------------+
//| Custom indicator iteration function                              |
//+------------------------------------------------------------------+
int start()
{
   int    counted_bars=IndicatorCounted();
   int limit, i;

   if (counted_bars==0)
   {
      x=Period();
      if (x>240) return(-1);
      ObjectCreate("PrevWeekHi", OBJ_TEXT, 0, 0, 0);
      ObjectSetText("PrevWeekHi", Space+"HIGH minggu lalu",fontsize,"Arial", Tomato);
      ObjectCreate("PrevWeekLo", OBJ_TEXT, 0, 0, 0);
      ObjectSetText("PrevWeekLo", Space+"LOW minggu lalu",fontsize,"Arial", DeepSkyBlue);
      ObjectCreate("PrevWeekMid", OBJ_TEXT, 0, 0, 0);
      ObjectSetText("PrevWeekMid", Space+"W_Open",fontsize,"Arial", LimeGreen);
   }

   limit=(Bars-counted_bars)-1;

   for (i=limit; i>=0;i--)
   {

      if (High[i+1]>LastWeekHi) LastWeekHi = High[i+1];
      if (Low [i+1]<LastWeekLo) LastWeekLo = Low [i+1];

      if (TimeDay(Time[i])!=TimeDay(Time[i+1]))
      {
         if(TimeDayOfWeek(Time[i])==1)
         {
            PrevWeekHi  = LastWeekHi;
            PrevWeekLo  = LastWeekLo;
            LastWeekHi  = Open[i];
            LastWeekLo  = Open[i];
            PrevWeekMid = Open[i];
         }
      }


      PrevWeekHiBuffer [i] = PrevWeekHi;
      PrevWeekLoBuffer [i] = PrevWeekLo;
      PrevWeekMidBuffer[i] = PrevWeekMid;

      ObjectMove("PrevWeekHi" , 0, Time[i], PrevWeekHi);
      ObjectMove("PrevWeekLo" , 0, Time[i], PrevWeekLo);
      ObjectMove("PrevWeekMid", 0, Time[i], PrevWeekMid);
   }

   return(0);
}
//+------------------------------------------------------------------+
Comments