Weekly_HILO_Shj_v1
Download script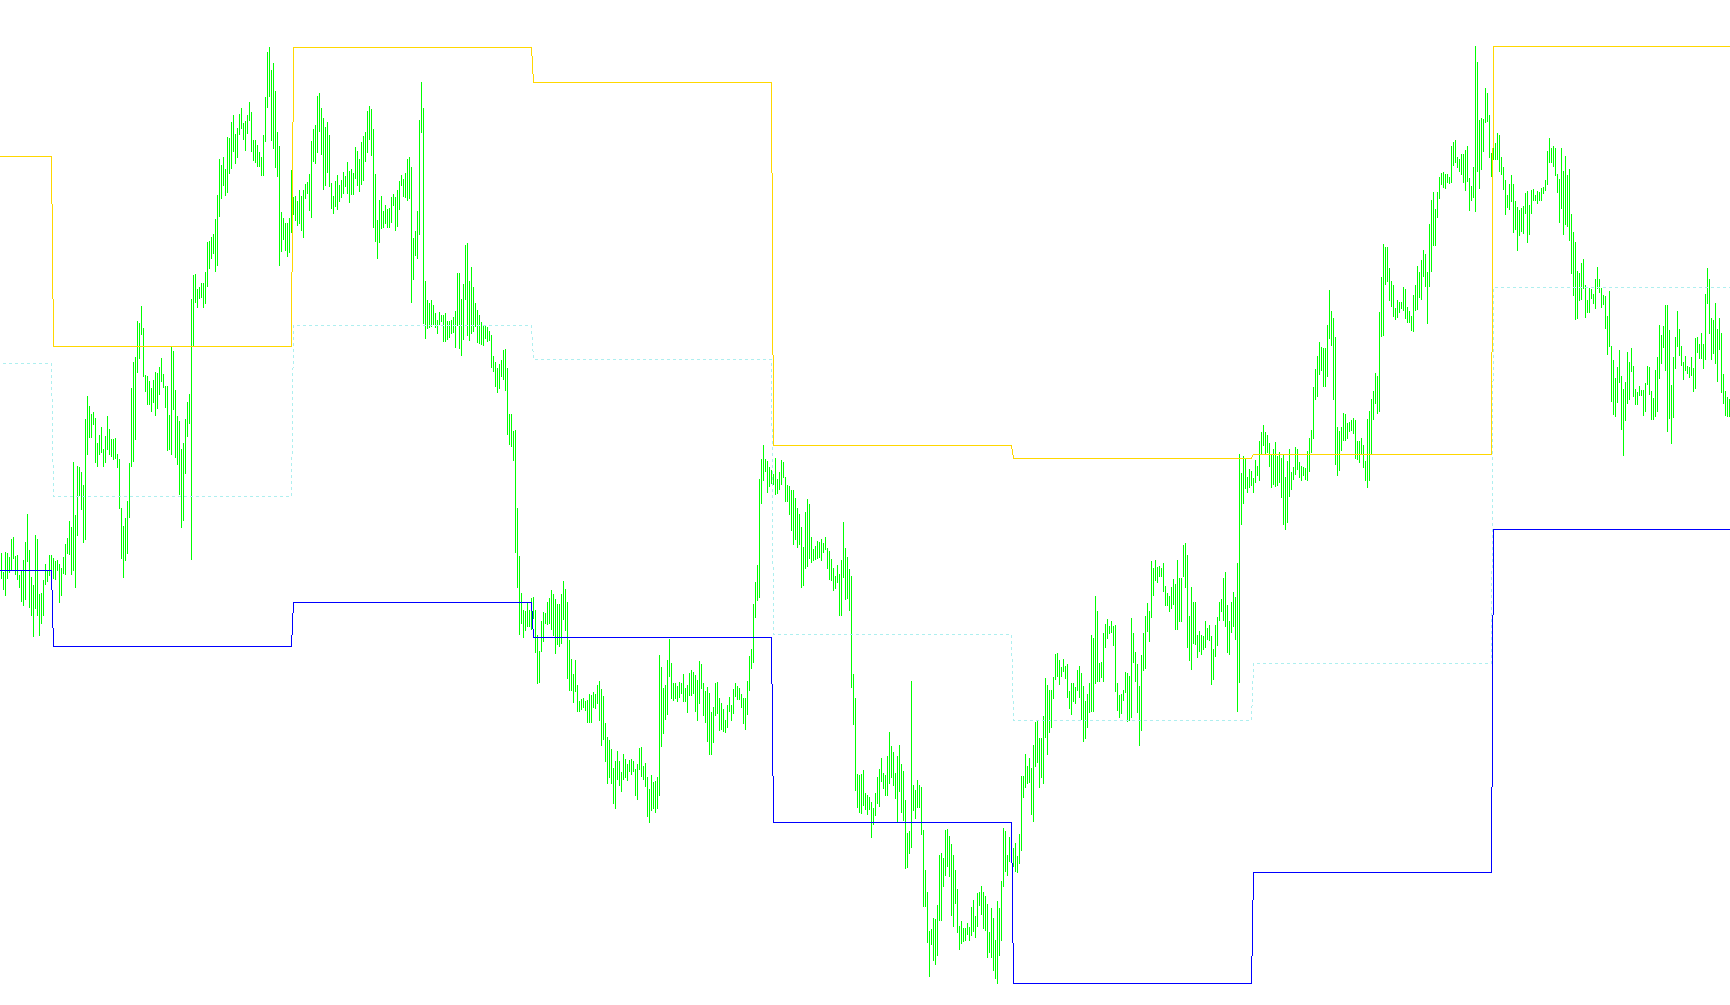
This tool is designed to help traders visualize key price levels from the previous trading week directly on their current charts. By automatically identifying and plotting these historical milestones, it allows you to see where the market has reacted in the past and how the current price relates to those significant boundaries.
Core Functionality
The script analyzes historical data to pinpoint three specific levels from the preceding week:
- Previous Week High: The highest price reached during the last full week of trading.
- Previous Week Low: The lowest price reached during the last full week of trading.
- 50% Midpoint: The exact halfway point between that week's high and low.
How It Works on Your Chart
The logic operates by scanning through the price history to "capture" the highest and lowest points of each completed week. Once a new week begins, the script locks in those values as the reference points for the current period.
On your visual display, the tool performs the following actions:
- Dynamic Plotting: It draws three distinct lines across your chart. These lines remain consistent throughout the current week, providing a steady horizontal guide for your analysis.
- Visual Labeling: To ensure clarity, the script places text labels on the chart (identifying the High, Low, and Midpoint) so you can easily distinguish which line is which at a glance.
- Automatic Updates: You don't need to manually calculate these figures. As the market moves into a new week, the tool automatically refreshes its data, shifting the lines to reflect the most recent week's performance.
Practical Application
This indicator is primarily used for identifying "Support" and "Resistance." Traders often look at the previous week's High and Low as significant psychological barriers; price may struggle to break above the high or fall below the low. Additionally, the 50% Midpoint serves as a balanced equilibrium zone, helping you determine if the current market is trading in the upper or lower half of the previous week's range.
//+------------------------------------------------------------------+
//|                                                 Weekly_HILO_Shj  |
//|                                                                  |
//|                                         http://www.metaquotes.ru |
//+------------------------------------------------------------------+
#property copyright "Copyright © 2005, "
#property link      "http://"
//----
#property indicator_chart_window
#property indicator_buffers 3
#property indicator_color1 Tomato
#property indicator_color2 DeepSkyBlue
#property indicator_color3 LimeGreen
#property indicator_width1 2
#property indicator_width2 2
//---- input parameters
//---- buffers
extern int space=44;
double PrevWeekHiBuffer[];
double PrevWeekLoBuffer[];
double PrevWeekMidBuffer[];
int fontsize=10;
double x;
double PrevWeekHi, PrevWeekLo, LastWeekHi, LastWeekLo,PrevWeekMid;
string Space;
//+------------------------------------------------------------------+
//| Custor indicator deinitialization function                       |
//+------------------------------------------------------------------+
int deinit()
  {
   ObjectDelete("PrevWeekHi");
   ObjectDelete("PrevWeekLo");
   ObjectDelete("PrevWeekMid");
   return(0);
  }
//+------------------------------------------------------------------+
//| Custom indicator initialization function                         |
//+------------------------------------------------------------------+
int init()
  {
   string short_name;
   int y;
//----
   SetIndexStyle(0,DRAW_LINE);
   SetIndexStyle(1,DRAW_LINE);
   SetIndexStyle(2,DRAW_LINE, STYLE_DOT);
   SetIndexBuffer(0, PrevWeekHiBuffer);
   SetIndexBuffer(1, PrevWeekLoBuffer);
   SetIndexBuffer(2, PrevWeekMidBuffer);
   short_name="Prev Hi-Lo levels";
   IndicatorShortName(short_name);
   SetIndexLabel(0, short_name);
   SetIndexDrawBegin(0,1);
//----
   for(y=0;y<=space;y++)
     {
      Space=Space+" ";
     }
   return(0);
  }
//+------------------------------------------------------------------+
//| Custom indicator iteration function                              |
//+------------------------------------------------------------------+
int start()
  {
   int    counted_bars=IndicatorCounted();
   int limit, i;
   if (counted_bars==0)
     {
      x=Period();
      if (x>240) return(-1);
      ObjectCreate("PrevWeekHi", OBJ_TEXT, 0, 0, 0);
      ObjectSetText("PrevWeekHi", Space+"HIGH minggu lalu",fontsize,"Arial", Tomato);
      ObjectCreate("PrevWeekLo", OBJ_TEXT, 0, 0, 0);
      ObjectSetText("PrevWeekLo", Space+"LOW minggu lalu",fontsize,"Arial", DeepSkyBlue);
      ObjectCreate("PrevWeekMid", OBJ_TEXT, 0, 0, 0);
      ObjectSetText("PrevWeekMid", Space+"50% hi-low ",fontsize,"Arial", LimeGreen);
     }
   limit=(Bars-counted_bars)-1;
   for(i=limit; i>=0;i--)
     {
      if (High[i+1]>LastWeekHi) LastWeekHi=High[i+1];
      if (Low [i+1]<LastWeekLo) LastWeekLo=Low [i+1];
      if (TimeDay(Time[i])!=TimeDay(Time[i+1]))
        {
         if(TimeDayOfWeek(Time[i])==1)
           {
            PrevWeekHi =LastWeekHi;
            PrevWeekLo =LastWeekLo;
            LastWeekHi =Open[i];
            LastWeekLo =Open[i];
            PrevWeekMid=(PrevWeekHi + PrevWeekLo)/2;
           }
        }
      PrevWeekHiBuffer [i]=PrevWeekHi;
      PrevWeekLoBuffer [i]=PrevWeekLo;
      PrevWeekMidBuffer[i]=PrevWeekMid;
//----
      ObjectMove("PrevWeekHi" , 0, Time[i], PrevWeekHi);
      ObjectMove("PrevWeekLo" , 0, Time[i], PrevWeekLo);
      ObjectMove("PrevWeekMid", 0, Time[i], PrevWeekMid);
     }

   return(0);
  }
//+------------------------------------------------------------------+
Comments