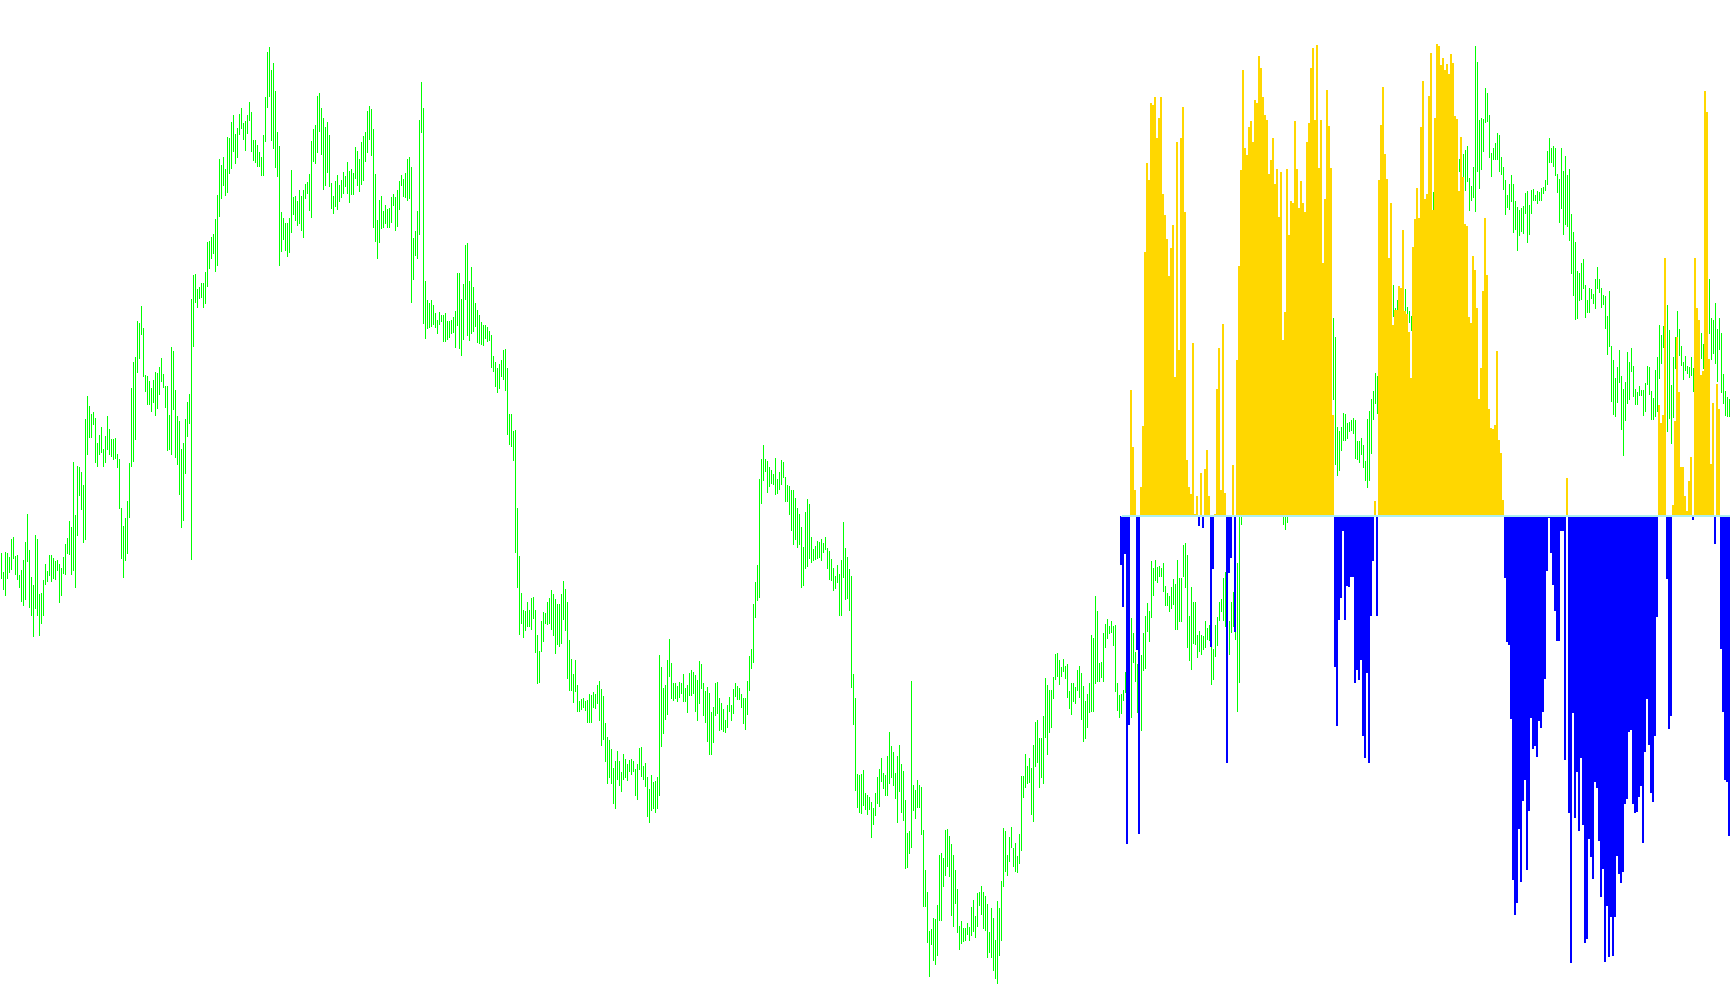
This tool is designed as a momentum oscillator that helps traders identify potential reversal points by measuring where the current price sits relative to its recent high and low extremes. It provides a visual representation of market "over-extension," signaling when a move may be becoming exhausted.
Core Logic and Calculation
The indicator looks back at a specific window of recent price action (40 bars) to determine the highest point reached and the lowest point dropped during that period. It then calculates where the current closing price falls within that range:
- Upper Range: When the price is near the top of the recent range, the indicator moves toward the upper limit.
- Lower Range: When the price is near the bottom of the recent range, the indicator moves toward the lower limit.
- The Zero Line: This acts as the equilibrium point. The tool separates movements into positive and negative values based on this center line.
Visual Representation
To make the data easy to read at a glance, the script uses a multi-colored histogram:
- Positive Momentum (Green): When the price is trading in the upper half of its recent range, a green histogram appears above the zero line.
- Negative Momentum (Red): When the price drops into the lower half of its recent range, a red histogram appears below the zero line.
- Baseline: A gray line marks the zero level, providing a clear visual boundary between "bullish" and "bearish" momentum zones.
Automated Alerts and Signals
Beyond just visual plotting, the script includes an automated logic system to notify traders of specific market conditions:
- Trend Switching: The logic monitors for "crossovers"—moments where the momentum shifts from positive to negative (or vice versa). When these shifts occur near the very edge of the current price action, the script flags a potential change in trend.
- Entry Notifications:
- Buy Signals: If the indicator identifies a shift toward positive momentum and the value reaches a specific threshold (above 15), an automated alert is triggered.
- Sell Signals: If the indicator identifies a shift toward negative momentum and the value drops below a specific threshold (below -15), a separate alert is triggered.
- On-Screen Status: The script provides real-time text comments on the chart, explicitly stating whether a "Buy Switch," "Sell Switch," or "No Switch" is currently active, helping traders stay aware of the current state of the market momentum.
/*
original formula)
WH:=HHV(HIGH,5);
WL:=LLV(LOW,5);

//WRD:=(( HHV( WH,36 )-c ) /( HHV(WH,36 ) - LLV( WL,36) ) ) *- 100,

//WDo:=WRD+50;

//WU:=IF(WDo>0,WDo,0);
//WD:=IF(WDo<0,WDo,0);
//{- this will give you the william's when it is below zero and it is plotted red}
//LN:=0;

*/

#property indicator_separate_window
#property indicator_buffers 3
#property indicator_color1 LimeGreen
#property indicator_color2 Red
#property indicator_color3 Gray
#property indicator_maximum 50
#property indicator_minimum -50
#property indicator_level1 0
#property indicator_level2 15
#property indicator_level3 -15
//---- input parameters


//---- buffers

double WU[],WD[],W[],Zero[];
int Ssw=0,Bsw=0;
//+------------------------------------------------------------------+
//| Custom indicator initialization function                         |
//+------------------------------------------------------------------+
int init()
  {
   string short_name;
//---- 3 additional buffers are used for counting.
   IndicatorBuffers(4);
   SetIndexBuffer(3,W);
//---- indicator lines
   SetIndexStyle(0,DRAW_HISTOGRAM,0,3);
   SetIndexBuffer(0,WU);
   SetIndexStyle(1,DRAW_HISTOGRAM,0,3);
   SetIndexBuffer(1,WD);
      SetIndexStyle(2,DRAW_LINE,0,2);
   SetIndexBuffer(2,Zero);
//---- name for DataWindow and indicator subwindow label
   short_name="William%R36 With Alert";
   IndicatorShortName(short_name);


//---- indicator lines


//----
   SetIndexDrawBegin(0,40);
//----
   return(0);
  }
//+------------------------------------------------------------------+
//| BSPVolume
//+------------------------------------------------------------------+
int start()
 {
   int    i,k,counted_bars=IndicatorCounted();

   if(Bars<=40) return(0);
//---- initial zero
/*
  if(counted_bars<1)
     {
      for(i=1;i<=CCIPeriod;i++) CCIBuffer[Bars-i]=0.0;
      for(i=1;i<=CCIPeriod;i++) DevBuffer[Bars-i]=0.0;
      for(i=1;i<=CCIPeriod;i++) MovBuffer[Bars-i]=0.0;
     }
*/
//---- last counted bar will be recounted
   int limit=Bars-counted_bars;
   if (counted_bars>0) limit++; else if (limit>300) limit=300;


   for(i=0; i<limit; i++)
      W[i]=50+(-100)*(High[Highest(NULL,0,MODE_HIGH,40,i)]-Close[i])/(High[Highest(NULL,0,MODE_HIGH,40,i)]-Low[Lowest(NULL,0,MODE_LOW,40,i)]);

   for(i=0; i<limit; i++) Zero[i]=0;

   for(i=0; i<limit; i++)
  {


     if (W[i]<0 && W[i+1]>0 && i<2)
     {
     Ssw=1;
     Bsw=0;
     }

     if (W[i]>0 && W[i+1]<0 && i<2)
     {
     Ssw=0;
     Bsw=1;
     }


     if (Bsw==1 && i<2 && W[i]>=15 )
         {
     Ssw=0;
     Bsw=0;
       Alert (Symbol()," ",Period()," Willy Says B U Y");
         }
       if (Ssw==1 && i<2 && W[i]<=-15 )
         {
     Ssw=0;
     Bsw=0;
       Alert (Symbol()," ",Period()," Willy Says S E L L");
     }
 if (Ssw==1) Comment ("SELL SWITCH ON","i ",i,"W[i] ",W[i],"W[i+1] ",W[i+1]);
 if (Bsw==1) Comment ("BUY SWITCH ON","i ",i,"W[i] ",W[i],"W[i+1] ",W[i+1]);
 if (Bsw==0 && Ssw==0) Comment ("NO SWITCH ON","i ",i,"W[i] ",W[i],"W[i+1] ",W[i+1]);


   if (W[i]>0)
      {WU[i]=W[i];WD[i]=0;}

      else if (W[i]<0)
          {WU[i]=0;WD[i]=W[i];}

            else {WU[i]=0;WD[i]=0;}
        }
            return(0);

}
Comments