wlxBWWiseMan-2
Download script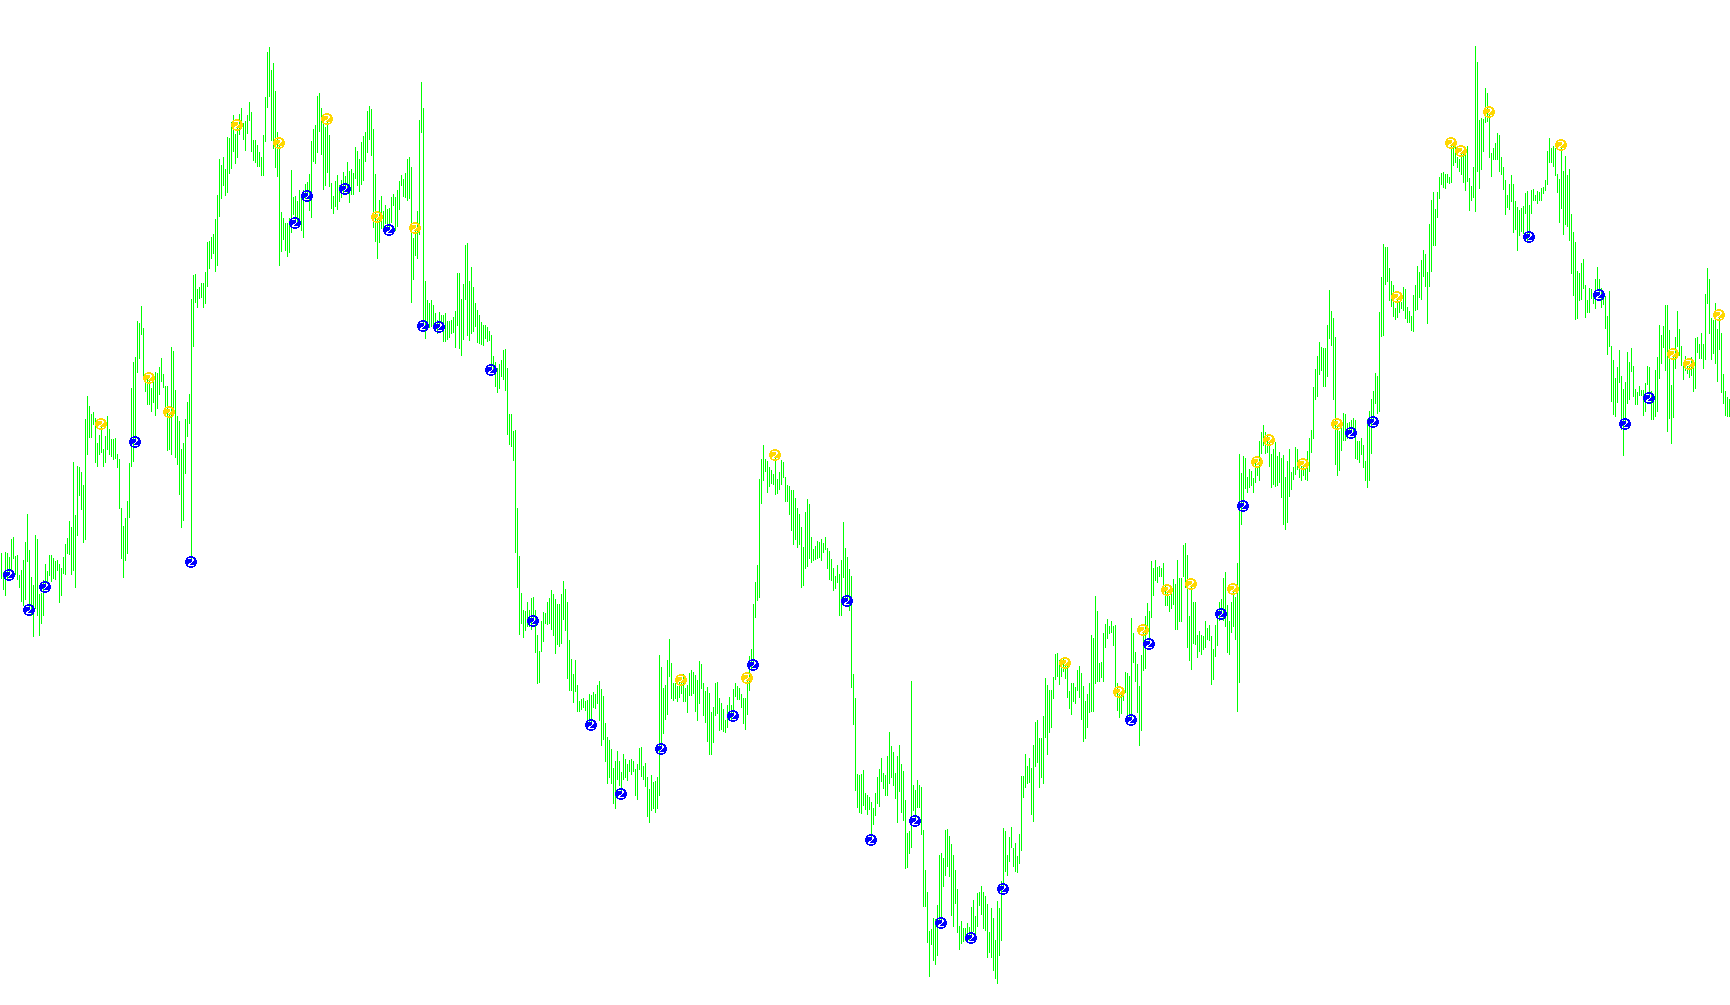
This tool is designed as a visual aid for traders, appearing directly on your price chart to highlight specific moments of momentum shifts. Rather than drawing continuous lines, it uses a system of "arrows" to signal potential turning points based on the behavior of a specific technical oscillator known as the Awesome Oscillator (AO).
How the Logic Works
The script scans historical price data to identify very specific "V-shaped" or "mountain-shaped" patterns in the momentum. It looks for instances where the movement of the market creates a distinct change in direction over a five-period sequence.
1. Identifying Upward Signals (Buy Interest) The tool searches for a specific peak in momentum. For a signal to appear, it checks for a sequence where:
- The momentum is currently positive (above zero).
- The values are moving in a steady, descending staircase pattern over four consecutive points.
- This indicates that while the trend might still be "positive," the strength is reaching a peak and beginning to curve downward, suggesting a potential exhaustion of the upward move. When this specific geometry is detected, an arrow appears above the price candle.
2. Identifying Downward Signals (Sell Interest) Similarly, the tool looks for a "valley" in momentum to identify potential selling opportunities. It triggers a signal when:
- The momentum is currently negative (below zero).
- The values are moving in a steady, ascending staircase pattern over four consecutive points.
- This indicates that while the trend is still "negative," the downward pressure is losing steam and beginning to curve upward. When this specific geometry is detected, an arrow appears below the price candle.
Key Visual Features
- Dynamic Placement: The arrows are automatically placed at a small distance above or below the candles (based on a user-adjustable setting) so they remain clearly visible without overlapping the actual price action.
- Color Coding: The tool uses distinct colors (Dark Orange and Magenta) to differentiate between potential upward momentum shifts and downward momentum shifts at a glance.
Summary for the User
Essentially, this script acts as a "momentum peak" detector. It filters out the noise of the market to find those specific moments where the internal strength of a move starts to curl back on itself, providing a visual cue that the current price direction may be reaching a temporary point of transition.
//+------------------------------------------------------------------+
//|                                               wlxBWWiseMan-2.mq4 |
//|                                          Copyright © 2005, wellx |
//|                                        http://www.metaquotes.net |
//+------------------------------------------------------------------+
#property copyright "Copyright © 2005, wellx"
#property link      "http://www.metaquotes.net"

#property indicator_chart_window
#property indicator_buffers 2
#property indicator_color1 DarkOrange
#property indicator_color2 Magenta

//---- input parameters

extern int       updown=8;
//---- buffers
double BWWM2Up[];
double BWWM2Down[];

int pos=0;
double AO,AO1,AO2,AO3,AO4;

//+------------------------------------------------------------------+
//| Custom indicator initialization function                         |
//+------------------------------------------------------------------+
int init()
  {
//---- indicators
   SetIndexStyle(0,DRAW_ARROW);
   SetIndexArrow(0,141);
   SetIndexBuffer(0,BWWM2Up);
   SetIndexEmptyValue(0,0.0);
   SetIndexStyle(1,DRAW_ARROW);
   SetIndexArrow(1,141);
   SetIndexBuffer(1,BWWM2Down);
   SetIndexEmptyValue(1,0.0);
//----
   return(0);
  }
//+------------------------------------------------------------------+
//| Custor indicator deinitialization function                       |
//+------------------------------------------------------------------+
int deinit()
  {
//---- TODO: add your code here

//----
   return(0);
  }
//+------------------------------------------------------------------+
//| Custom indicator iteration function                              |
//+------------------------------------------------------------------+
int start()
  {
   int  cbars=IndicatorCounted();
   if  (cbars<0) return(-1);
   if  (cbars>0) cbars--;
//---- TODO: add your code here
   if (cbars > (Bars-40)) pos=(Bars-40);
   else pos=cbars;
//----
   while (pos > 0)
   {
    BWWM2Up[pos]=NULL;
    BWWM2Down[pos]=NULL;
    AO=iAO(NULL,0,pos);
    AO1=iAO(NULL,0,pos+1);
    AO2=iAO(NULL,0,pos+2);
    AO3=iAO(NULL,0,pos+3);
    AO4=iAO(NULL,0,pos+4);

    if (
        (AO4>0.0 && AO3>0.0 )
          &&
        (AO4<AO3 && AO3>AO2 && AO2>AO1 && AO1>AO)
       )
        BWWM2Up[pos]=(High[pos]+updown*Point);

    if (
        (AO4<0.0 && AO3<0.0 )
          &&
        (AO4>AO3 && AO3<AO2 && AO2<AO1 && AO1<AO)
       )
        BWWM2Down[pos]=(Low[pos]-updown*Point);
     pos--;
    }


    return(0);
  }
//+------------------------------------------------------------------+
Comments