WPRSI_signal_V.2(SoundAlarm)
Download script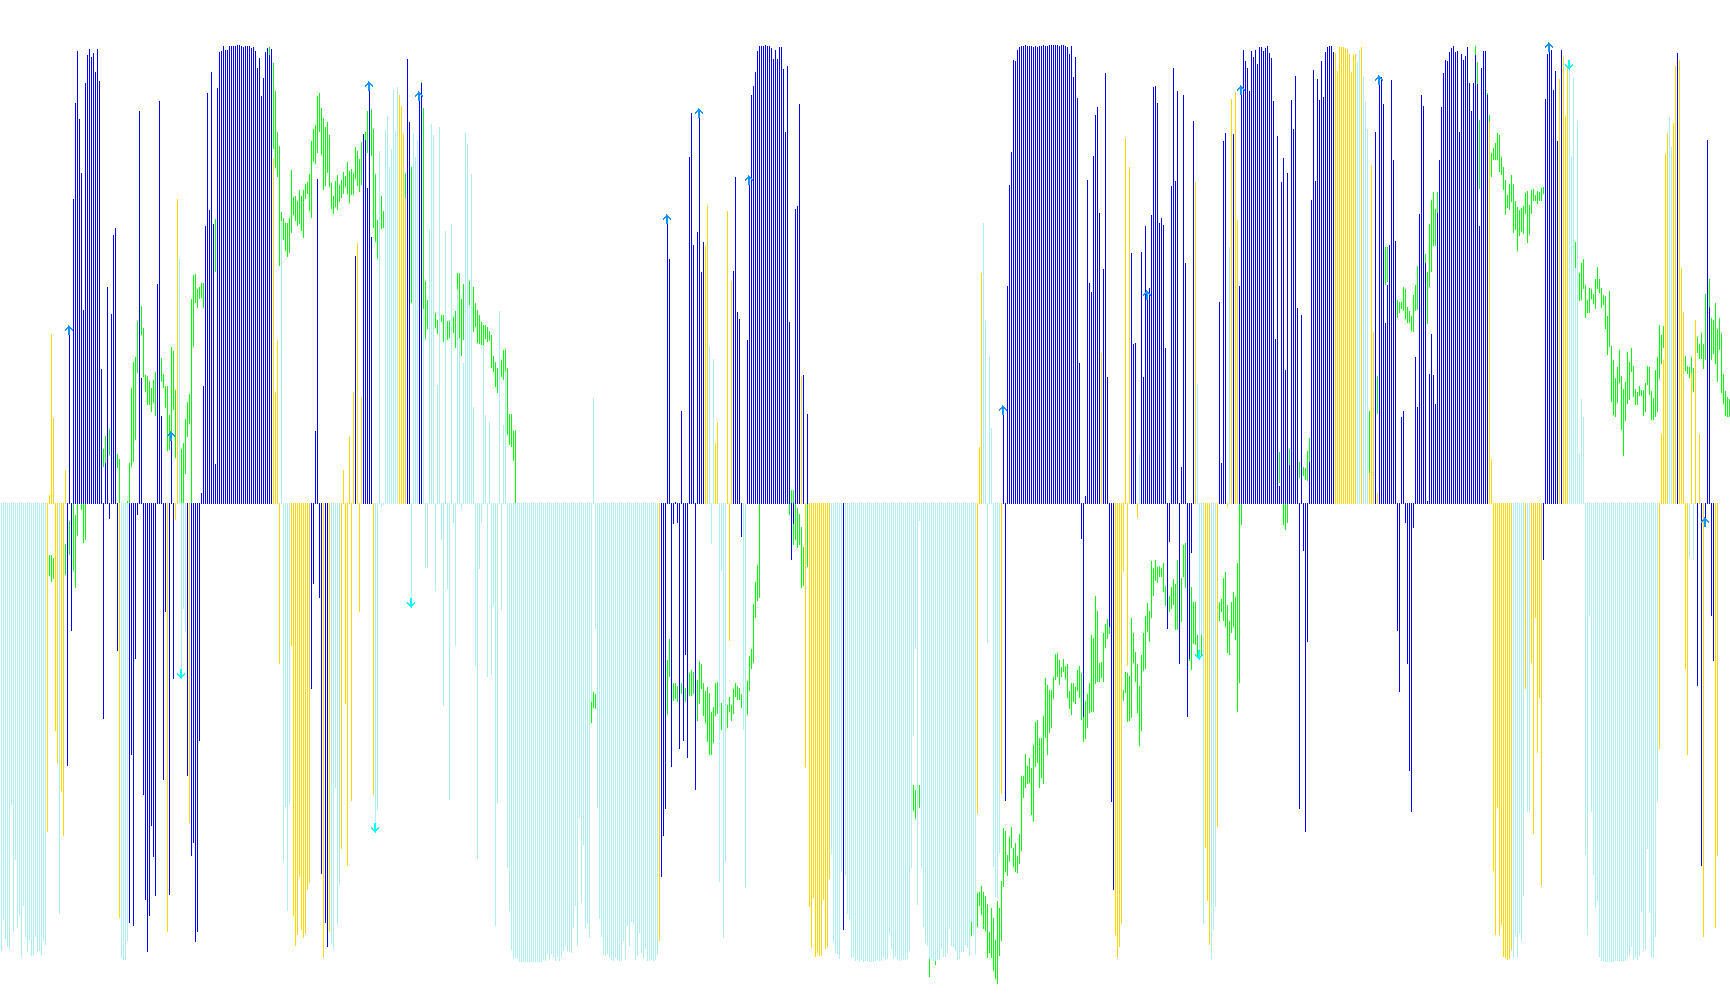
This technical tool is designed as a custom market indicator that combines multiple momentum and price action metrics to identify potential trading opportunities. It processes historical price data to determine market trends and generates visual signals on your chart, along with optional audio alerts for real-time notifications.
Core Methodology
The script operates by simultaneously monitoring two primary technical indicators: the Williams Percent Range (WPR) and the Relative Strength Index (RSI). By analyzing these two different perspectives of momentum—one focusing on price range and the other on velocity—the tool attempts to filter out market "noise" and identify high-probability directional shifts.
Operational Logic
The indicator follows a specific sequence of evaluations to decide what information to display:
- Price Action Smoothing: The script calculates a customized sum based on the relationship between opening, closing, high, and low prices over a specific look-back period (defined by the "Waytoway" parameter). This value is then processed through a mathematical formula to smooth out fluctuations, ensuring the signals are more stable.
- Trend Identification: It categorizes market behavior into several zones based on the interaction between the WPR and RSI values. These zones help distinguish between standard market movement and specific conditions that might precede a trend change.
- Entry Signal Detection (Long & Short):
- Long Signals: The tool looks for specific "crossover" behavior where the Williams Percent Range moves above a certain threshold while the RSI remains in positive territory. It further verifies this by checking that the price hasn't recently breached other resistance levels. If these conditions are met, it identifies a potential upward move and triggers a "Start Long" alert.
- Short Signals: Conversely, the tool monitors for the WPR dropping below specific thresholds while the RSI remains in negative territory. It validates this by ensuring the price has not recently breached certain support levels. When confirmed, it identifies a potential downward move and triggers a "Start Short" alert.
Visual and Audible Feedback
The logic translates these complex calculations into user-friendly visual elements:
- Histograms: These represent the continuous trend data processed by the script, helping you visualize the current market strength.
- Arrows: Specific icons appear on the chart to mark exact points where the logic confirms a "Long" or "Short" opportunity.
- Alert System: If enabled in the settings, the script will play a sound file and display a pop-up notification on your screen whenever a new entry signal is detected, allowing for immediate action without needing to watch the chart constantly.
//+------------------------------------------------------------------+
//|                                  WPRSI signal V2(SoundAlarm).mq4 |
//|                                                           gumgum |
//|                                           1967policmen@gmail.com |
//+------------------------------------------------------------------+
#property copyright "gumgum"
#property link      "1967policmen@gmail.com"

#property  indicator_separate_window
#property indicator_buffers 5
#property indicator_color1 Gray
#property indicator_color2 Blue
#property indicator_color3 Red
#property indicator_color4 Blue
#property indicator_color5 Red
#property  indicator_width1  5
//---- input parameters
extern int WPRSIperiod  =27;
extern int Waytoway     =27;
extern int filterUP     =10;
extern int filterDN     =10;
extern bool UseSound   =false;
extern string SoundFile  ="Alert.wav";
//---- buffers
double ExtMapBuffer1[];
double ExtMapBuffer2[];
double ExtMapBuffer3[];
double ExtMapBuffer4[];
double ExtMapBuffer5[];
//----
double alert;

//+------------------------------------------------------------------+
//| Custom indicator initialization function                         |
//+------------------------------------------------------------------+
int init()
  {
//---- indicators
SetIndexStyle(2,DRAW_HISTOGRAM,0,0);
SetIndexBuffer(2, ExtMapBuffer3);
//----
SetIndexStyle(0,DRAW_HISTOGRAM,0,0);
SetIndexBuffer(0, ExtMapBuffer1);
//----
SetIndexStyle(1,DRAW_HISTOGRAM,0,0);
SetIndexBuffer(1, ExtMapBuffer2);
//----
SetIndexStyle(3,DRAW_ARROW,0,0);
SetIndexArrow(3, 233);
SetIndexBuffer(3, ExtMapBuffer4);
//----
SetIndexStyle(4,DRAW_ARROW,0,0);
SetIndexArrow(4, 234);
SetIndexBuffer(4, ExtMapBuffer5);

//---- name for DataWindow and indicator subwindow label
   IndicatorShortName("WPRSI sinal v.2("+WPRSIperiod+","+Waytoway+","+filterUP+","+filterDN+")");
//----

   return(0);
  }
//+------------------------------------------------------------------+
//| Custor indicator deinitialization function                       |
//+------------------------------------------------------------------+
int deinit()
  {
//----
   return(0);
  }
//+------------------------------------------------------------------+
//| Custom indicator iteration function                              |
//+------------------------------------------------------------------+
int start()
  {
   int limit;
   int counted_bars=IndicatorCounted();
//---- check for possible errors
   if(counted_bars < 0)
      return(-1);
//---- last counted bar will be recounted
   if(counted_bars > 0)
      counted_bars--;
   limit=Bars - counted_bars;
//----

   for(int i=1; i < limit; i++)
     {
      //---
               double upsum=0;
               int up1;
               if(((iWPR(NULL,0,WPRSIperiod,i)>-50)&&(iRSI(NULL,0,WPRSIperiod,PRICE_MEDIAN,i)<50))||((iWPR(NULL,0,WPRSIperiod,i)<-50)&&(iRSI(NULL,0,WPRSIperiod,PRICE_MEDIAN,i)>50)))
               {
               upsum=0;
               for(up1=0;up1<=Waytoway;up1++)
               {
               upsum=(Close[i+up1]-Open[i+up1])/(High[i+up1]-Low[i+up1])+upsum;
               }
               ExtMapBuffer1[i]=logic(upsum);
               }
      //----
      if((iWPR(NULL,0,WPRSIperiod,i)>-50)&&(iRSI(NULL,0,WPRSIperiod,PRICE_MEDIAN,i)>50))
      {
               upsum=0;
               for(up1=0;up1<=Waytoway;up1++)
               {
               upsum=(Close[i+up1]-Open[i+up1])/(High[i+up1]-Low[i+up1])+upsum;
               }
               ExtMapBuffer2[i]=logic(upsum);
      }
      //----
      if( (iWPR(NULL,0,WPRSIperiod,i)>-20)&&(iWPR(NULL,0,WPRSIperiod,i+1)<-20)&&(iRSI(NULL,0,WPRSIperiod,PRICE_MEDIAN,i)>50)           )
         {
         double z=0;
         for(int k=2;k<=filterUP+2;k++)
         {

         if(iWPR(NULL,0,WPRSIperiod,k+i)>-20){z=1;  }

         }

               if(z==0)
               {
               upsum=0;
               for(up1=0;up1<=Waytoway;up1++)
               {
               upsum=(Close[i+up1]-Open[i+up1])/(High[i+up1]-Low[i+up1])+upsum;
               }
               ExtMapBuffer4[i]=logic(upsum);
                  if(i==1&&(alert!=Time[1]))
                  {
                  if(UseSound){PlaySound(SoundFile);Alert("Start Long");}
                  }
                  alert=Time[1];

               }
               }
      //----
      if((iWPR(NULL,0,WPRSIperiod,i)<-50)&&(iRSI(NULL,0,WPRSIperiod,PRICE_MEDIAN,i)<50))
      {
               upsum=0;
               for(up1=0;up1<=Waytoway;up1++)
               {
               upsum=(Close[i+up1]-Open[i+up1])/(High[i+up1]-Low[i+up1])+upsum;
               }
               ExtMapBuffer3[i]=logic(upsum);
      }
      //----
      if( (iWPR(NULL,0,WPRSIperiod,i+1)>-80)&&(iWPR(NULL,0,WPRSIperiod,i)<-80)&&(iRSI(NULL,0,WPRSIperiod,PRICE_MEDIAN,i)<50)           )

         {
         double h=0;
         for(int c=2;c<=filterDN+2;c++)
         {

         if(iWPR(NULL,0,WPRSIperiod,c+i)<-80){h=1;  }

         }

               if(h==0)
               {
               upsum=0;
               for(up1=0;up1<=Waytoway;up1++)
               {
               upsum=(Close[i+up1]-Open[i+up1])/(High[i+up1]-Low[i+up1])+upsum;
               }
               ExtMapBuffer5[i]=logic(upsum);
                  if(i==1&&(alert!=Time[1]))
                  {
                  if(UseSound){PlaySound(SoundFile);Alert("Start Short");}
                  }
                  alert=Time[1];
                  }
               }


     }
//----
   return(0);
  }
double logic(double cinyan)//
{

return((MathExp(cinyan)-MathExp(-cinyan))/(MathExp(cinyan)+MathExp(-cinyan)));
}
//+------------------------------------------------------------------+
Comments