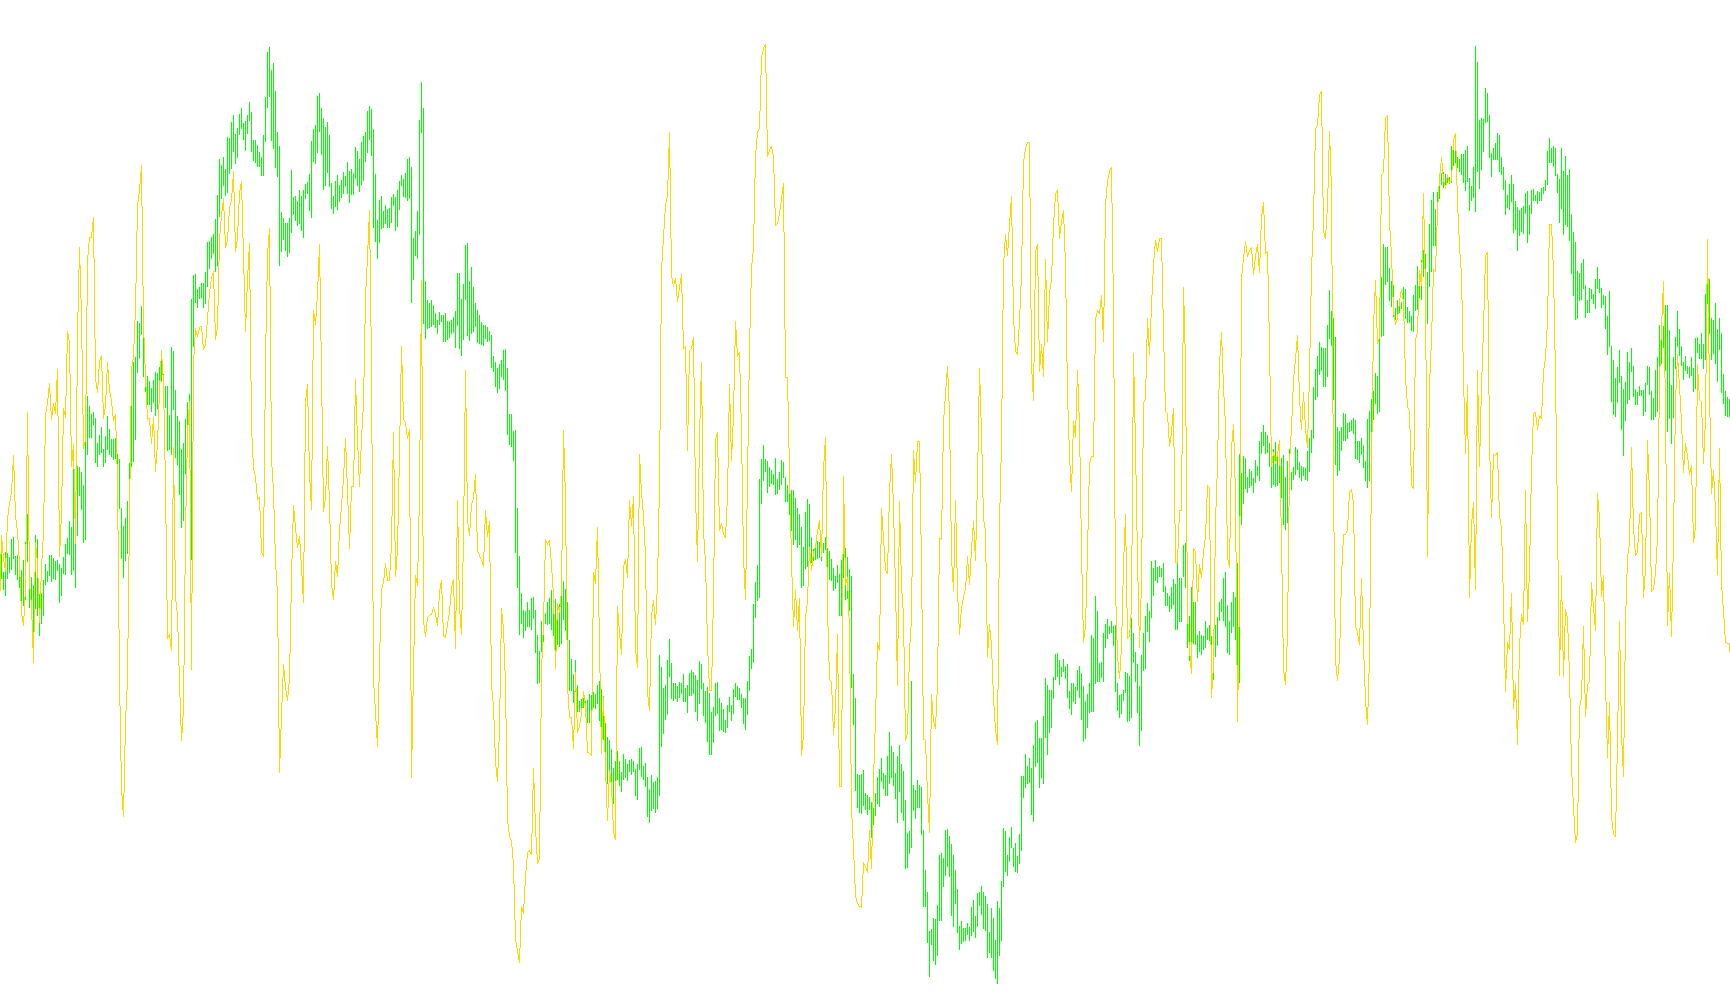
This tool is a technical market indicator designed to help traders visualize price momentum in a dedicated window separate from the main price chart. It simplifies complex market movements into a single, easy-to-read line that fluctuates within a specific range (0 to 100).
How it Works
The script focuses on a mathematical calculation known as the Relative Strength Index (RSI). This calculation looks at the speed and change of price movements over a set number of recent candles—in this specific version, it evaluates the last 8 periods of data.
By analyzing whether prices are rising or falling with significant strength, the indicator generates a value that tells you how "overextended" the market might be:
- Momentum Tracking: The red line on the chart moves up when the price is gaining strength and down when it is losing momentum.
- Visual Boundaries: Because the indicator is set to a scale of 0 to 100, it allows you to see where the current market activity sits relative to historical extremes.
- Data Processing: Every time the price moves, the script automatically recalculates the last 8 data points to ensure the line reflects the most current market conditions in real-time.
What this means for you
Instead of looking at raw price candles and trying to guess if a move is getting exhausted, you can watch the red line. When the line trends significantly in one direction, it highlights the prevailing momentum. This helps traders identify potential turning points or areas where the market might be becoming overbought or oversold, providing a clearer picture of the "heartbeat" of the currency or asset you are trading.
//+------------------------------------------------------------------+
//|                                                            x.mq4 |
//|                                         Copyright © 2007, HexSys |
//|                                                                  |
//+------------------------------------------------------------------+
#property copyright "Copyright © 2007, HexSys"
#property link      ""

#property indicator_separate_window
#property indicator_minimum 0
#property indicator_maximum 100
#property indicator_buffers 1
#property indicator_color1 Red
//---- input parameters
extern int       PeriodRSI=8;
//---- buffers
double ExtMapBuffer1[];
//+------------------------------------------------------------------+
//| Custom indicator initialization function                         |
//+------------------------------------------------------------------+
int init()
  {
//---- indicators
   SetIndexStyle(0,DRAW_LINE);
   SetIndexBuffer(0,ExtMapBuffer1);
//----
   return(0);
  }
//+------------------------------------------------------------------+
//| Custom indicator deinitialization function                       |
//+------------------------------------------------------------------+
int deinit()
  {
//----

//----
   return(0);
  }
//+------------------------------------------------------------------+
//| Custom indicator iteration function                              |
//+------------------------------------------------------------------+
int start()
  {
   int  i,limit,counted_bars=IndicatorCounted();
   if (counted_bars==0) limit=Bars-PeriodRSI;
   if (counted_bars>0) limit=Bars-counted_bars;
//----
   for(i=limit;i>=0;i--) ExtMapBuffer1[i]=iRSI(NULL,0,PeriodRSI,MODE_CLOSE,i);
//----
   return(0);
  }
//+------------------------------------------------------------------+
Comments