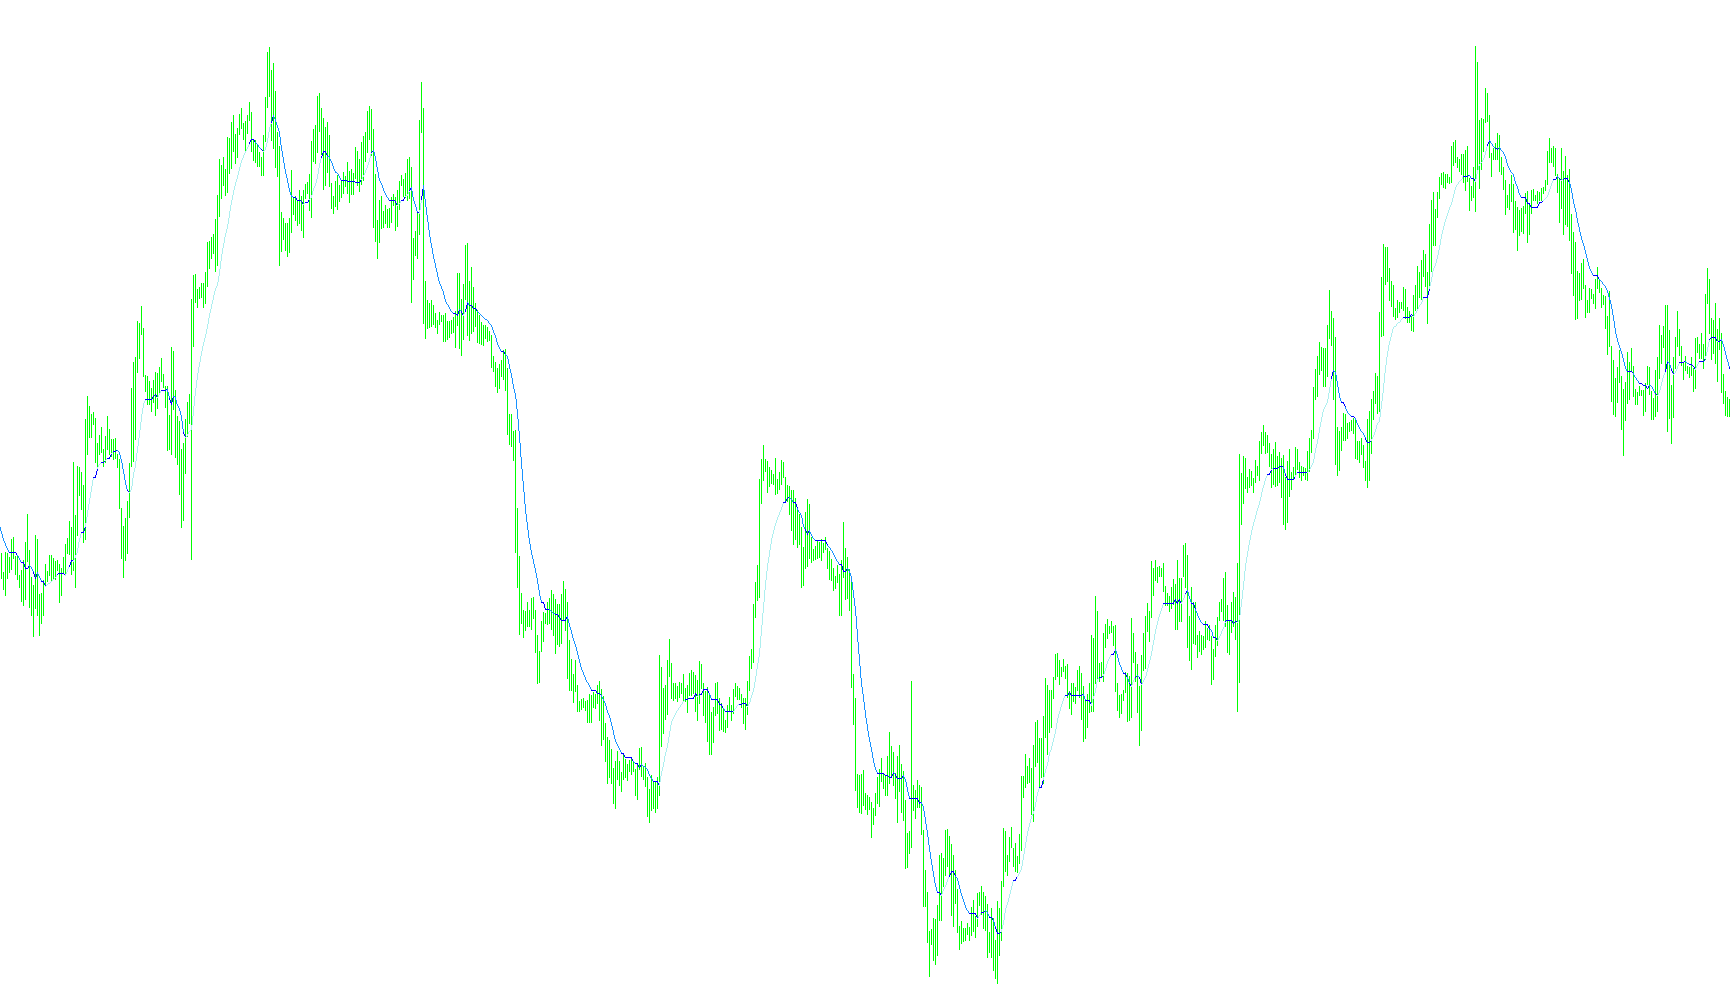
This technical indicator is designed to provide visual clarity on financial charts by tracking price trends and identifying significant movements based on a modified moving average calculation. Instead of showing a single static line, it dynamically adjusts its behavior to help traders distinguish between steady market flow and active price shifts.
Core Logic Overview
The script works by analyzing the relationship between two different moving average calculations simultaneously. Its primary goal is to detect "breakouts" or significant shifts in momentum while filtering out minor market "noise" that might otherwise create false signals.
Key Functionalities
-
Trend Detection and Filtering: The tool monitors the difference between two price averages. It only reacts when the gap between these values exceeds a specific user-defined threshold (the "porog"). This ensures that the indicator remains stable during sideways markets and only changes its state when a meaningful trend change occurs.
-
Dynamic Signal Generation: When the market movement stays within the normal range, the indicator holds its current position, creating a smooth visual path. However, once the price action crosses the defined threshold, the indicator recalculates to reflect the new direction of the market.
-
Visual Color Coding: The script categorizes market behavior into distinct visual components to make it easier to read:
- Bullish Movement: It identifies segments where the price is interacting with or moving above the trend line.
- Bearish Movement: It identifies segments where the price is interacting with or moving below the trend line.
- Neutral/Transition Zones: It tracks areas where the price sits directly on the signal, helping to identify moments of equilibrium.
User Customization
The logic allows for several adjustable parameters that dictate how sensitive or smooth the indicator appears:
- Periodicity: Determines the timeframe over which the moving averages are calculated.
- Threshold Sensitivity: Controls how much price movement is required before the indicator triggers a "signal" change.
- Calculation Methods: Allows the user to choose the specific mathematical way the averages are smoothed (e.g., simple vs. exponential styles).
In summary, this tool acts as a smart visual filter that highlights the direction of the market trend while ignoring small, insignificant price fluctuations, providing a cleaner view of where the "true" momentum is heading.
//+------------------------------------------------------------------+
//|                                                 Xma_Coloured.mq4 |
//|                 Copyright © 2009, XrustSolution. Toys from Vinin.|
//|              http://www.xrust.ucoz.net  http://www.vinin.ucoz.ru |
//|                  xrust@land.ru  xrust@gmail.com  xrust@mksat.net |
//|      Õîòü äàííàÿ ïðîãðàììà è ÿâëÿåòñÿ ñâîáîäíî ðàñïðîñòðàíÿåìîé, |
//|           ïóáëèêàöèÿ åå áåç óêàçàíèÿ íà ïåðâîèñòî÷íèê çàïðåùåíà  |
//-------------------------------------------------------------------+
#property copyright "#Copyright © 2008, XrustSolution.#"
#property link      "#http://www.xrust.ucoz.net#"
#property indicator_chart_window
#property indicator_buffers 4
#property indicator_color2 Yellow
#property indicator_color3 Blue
#property indicator_color4 Red
extern int period=12;
extern int porog =3;
extern int metod =1;
extern int metod2=1;
extern int prise =0;
//---- buffers
double Signal[];
double Up[];
double Dn[];
double Fl[];
//+------------------------------------------------------------------+
void init(){
   SetIndexStyle(0,DRAW_NONE);
   SetIndexDrawBegin(0,0);
   SetIndexBuffer(0,Signal);
   SetIndexStyle(1,DRAW_LINE);
   SetIndexDrawBegin(1,0);
   SetIndexBuffer(1,Fl);
   SetIndexStyle(2,DRAW_LINE);
   SetIndexDrawBegin(2,0);
   SetIndexBuffer(2,Up);
   SetIndexStyle(3,DRAW_LINE);
   SetIndexDrawBegin(3,0);
   SetIndexBuffer(3,Dn);
   IndicatorShortName("Xma"+period+porog);
return;}
//+------------------------------------------------------------------+
int start() {
   int limit;
   double tmp1,tmp2;
   int counted_bars=IndicatorCounted();
   int i;
   if(counted_bars<0) return(-1);
   if(counted_bars>0) counted_bars--;
   limit=Bars-counted_bars;
   for (i = limit;i>=0;i--){
     tmp1=iMA(Symbol(),0,period,0,metod,prise,i);
     tmp2=iMA(Symbol(),0,period,1,metod2,prise,i);
     if(MathAbs(tmp1-tmp2)>=porog*Point){
       Signal[i]=tmp2;
       if(i>0){
         if(Close[i]<=Signal[i]){Dn[i]=Signal[i];}else{Fl[i]=Signal[i];}
         if(Close[i] >=Signal[i]){Up[i]=Signal[i];}else{Fl[i]=Signal[i];}
       }else{Fl[i]=Signal[i];}
     }else{
       Signal[i]=Signal[i+1];
       Fl[i]=Signal[i];
     }
   }
   return(0);}
//+------------------------------------------------------------------+
Comments