ytg_MA_Open_V0
Download script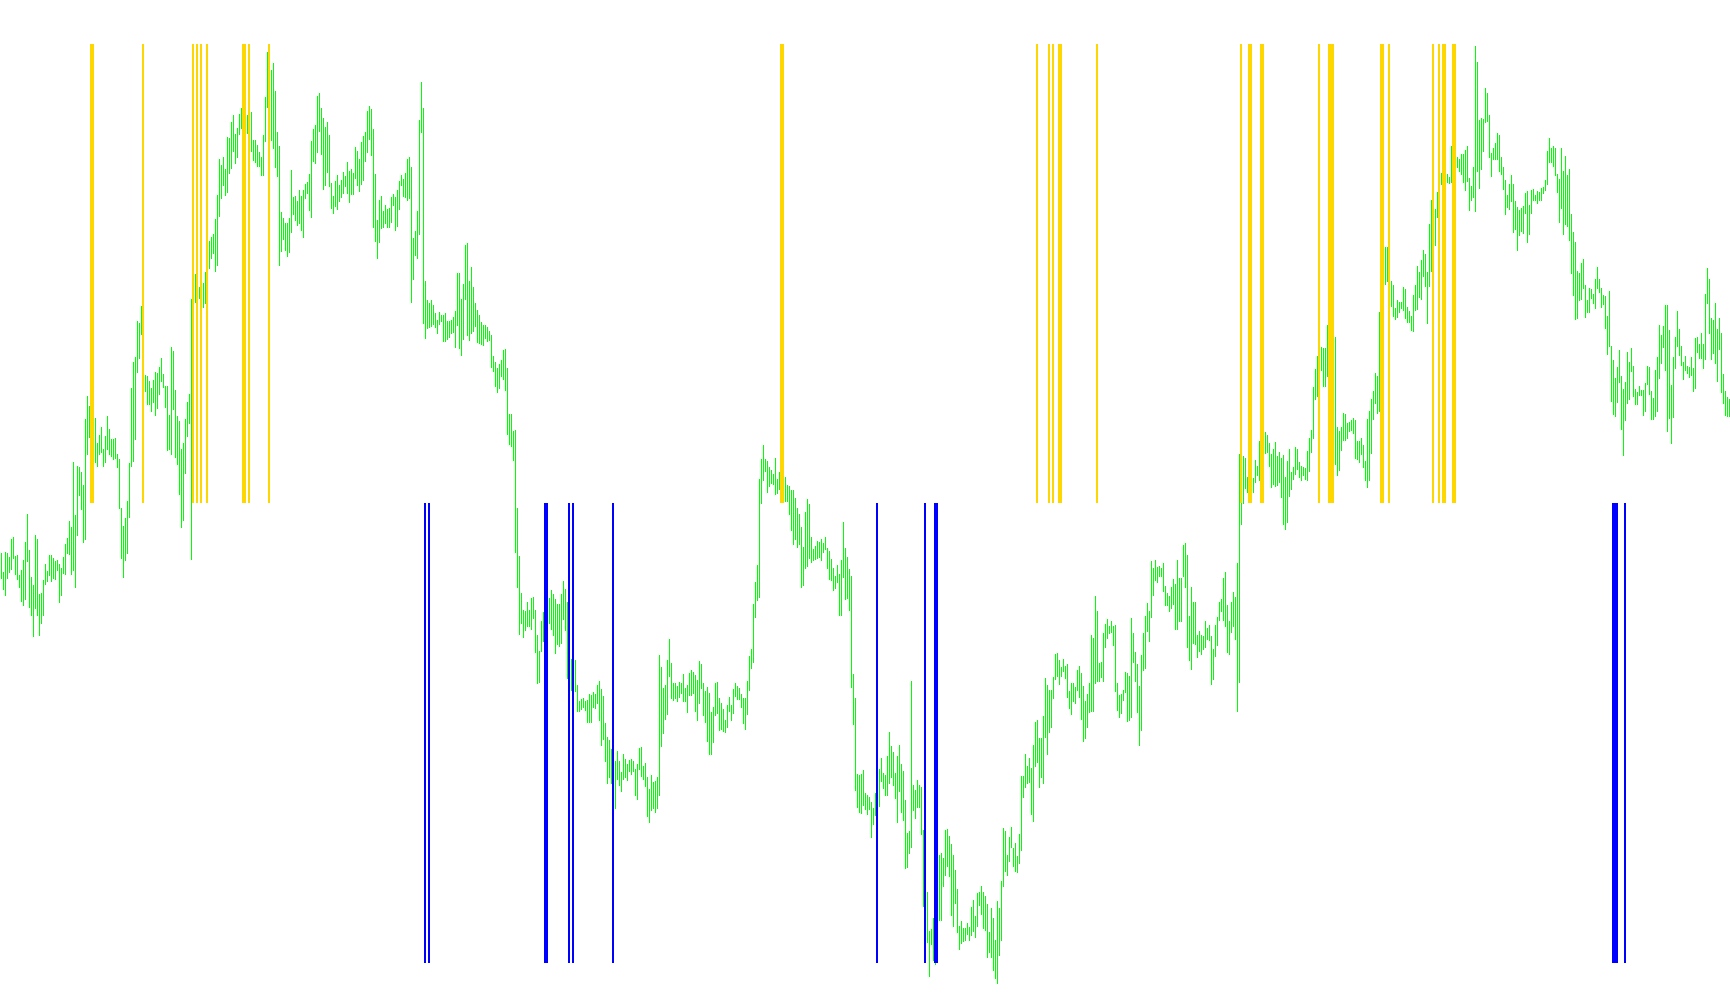
This tool is designed as a visual trading assistant that helps identify specific price action patterns based on the relationship between current market prices and a Moving Average. Instead of just showing a trend line, it acts as a specialized filter to highlight potential "Buy" and "Sell" opportunities in real-time.
How the Logic Works
The script continuously monitors the price movement on your charts by calculating a specific Moving Average. It then establishes a dynamic "buffer zone" above and below that average to create a detection area for specific price behaviors.
1. Buy Signal Detection (Bullish)
The tool looks for a very specific price configuration where the market shows strong upward momentum relative to the Moving Average:
- Price Position: The opening price of a candle must be significantly above the upper boundary of the buffer zone.
- Interaction: While the opening price is high, the "Low" of that same candle must actually dip into the buffer zone (staying above the average line but below the top boundary).
- Visual & Alert: When this occurs, the script places a green histogram mark on the chart and triggers an audible alert notifying you of a potential "Buy" opportunity.
2. Sell Signal Detection (Bearish)
Conversely, the tool monitors for downward momentum using the same logic in reverse:
- Price Position: The opening price of a candle must be significantly below the lower boundary of the buffer zone.
- Interaction: While the opening price is low, the "High" of that same candle must reach up into the buffer zone (staying below the average line but above the bottom boundary).
- Visual & Alert: When this condition is met, the script places a red histogram mark on the chart and triggers an audible alert notifying you of a potential "Sell" opportunity.
Key Features for the User
- Customizable Sensitivity: You can adjust the period of the Moving Average, the calculation method, and the size of the buffer zones to suit different markets (e.g., Forex, Stocks, or Commodities) and timeframes.
- Real-Time Notifications: The script includes an intelligent alert system that ensures you are notified of new signals immediately. It is designed to prevent "spam" by only alerting you once per candle for each symbol.
- Visual Clarity: By using a separate window histogram, the tool provides a clean visual history of where these specific price interactions occurred, allowing you to see patterns over time without cluttering your main price chart.
//+------------------------------------------------------------------+
//|                                                   MA_Open_V0.mq4 |
//|                                                     Yuriy Tokman |
//|                                            yuriytokman@gmail.com |
//+------------------------------------------------------------------+
#property copyright "Yuriy Tokman"
#property link      "yuriytokman@gmail.com"

#property indicator_separate_window

#property indicator_buffers 2
#property indicator_color1 Lime
#property indicator_color2 Red

extern string __íàñòðîéêè_íèäèêàòîðà__ = "Çäåñü èçìåíÿåì";
extern int PeriodMA = 33;
extern int ma_method = 1;//0-3
extern int applied_price = 6;//0-6
extern int âåðõíèé_ïîðîã = 250;
extern int íèæíèé_ïîðîã = 250;

double ExtMapBuffer0[];
double ExtMapBuffer1[];

datetime LastTime=0;
//+------------------------------------------------------------------+
//| Custom indicator initialization function                         |
//+------------------------------------------------------------------+
int init()
  {
//---- indicators
   SetIndexStyle(0,DRAW_HISTOGRAM,EMPTY,3);
   SetIndexBuffer(0,ExtMapBuffer0);

   SetIndexStyle(1,DRAW_HISTOGRAM,EMPTY,3);
   SetIndexBuffer(1,ExtMapBuffer1);

   IndicatorShortName("MA_Open ("+PeriodMA+")");

   SetIndexLabel(0," ISQ#481971287  ");
   SetIndexLabel(1," yuriytokman@gmail.com  ");
//----
   return(0);
  }
//+------------------------------------------------------------------+
//| Custom indicator deinitialization function                       |
//+------------------------------------------------------------------+
int deinit()
  {
//----

//----
   return(0);
  }
//+------------------------------------------------------------------+
//| Custom indicator iteration function                              |
//+------------------------------------------------------------------+
int start()
  {
   int limit;
   int counted_bars=IndicatorCounted();

   if(counted_bars<0) return(-1);

   if(counted_bars>0) counted_bars--;
   limit=Bars-counted_bars;

   for(int i=limit; i>=0; i--)
   {
    double MA_0 = iMA( NULL,0,PeriodMA,0,ma_method,applied_price,i);
    double MA_H = MA_0 + âåðõíèé_ïîðîã*Point;
    double MA_L = MA_0 - íèæíèé_ïîðîã*Point;

    if(Open[i]>MA_H&&Low[i]>MA_0&&Low[i]<MA_H)
     {
      if(Time[0]!= LastTime)
       {
        Alert("îòêàò äëÿ áàé "," Ñèìâîë ",Symbol()," Ïåðèîä ",GetNameTF());
        LastTime = Time[0];
       }
      ExtMapBuffer0[i]=1;
     }
    else ExtMapBuffer0[i]=0;
    if(Open[i]<MA_L&&High[i]<MA_0&&High[i]>MA_L)
     {
      if(Time[0]!= LastTime)
       {
        Alert("îòêàò äëÿ ñåëë "," Ñèìâîë ",Symbol()," Ïåðèîä ",GetNameTF());
        LastTime = Time[0];
       }
      ExtMapBuffer1[i]=-1;
     }
    else ExtMapBuffer1[i]=0;
   }
//----
   return(0);
  }
//+------------------------------------------------------------------+
string GetNameTF(int TimeFrame=0) {
  if (TimeFrame==0) TimeFrame=Period();
  switch (TimeFrame) {
    case PERIOD_M1:  return("M1");
    case PERIOD_M5:  return("M5");
    case PERIOD_M15: return("M15");
    case PERIOD_M30: return("M30");
    case PERIOD_H1:  return("H1");
    case PERIOD_H4:  return("H4");
    case PERIOD_D1:  return("Daily");
    case PERIOD_W1:  return("Weekly");
    case PERIOD_MN1: return("Monthly");
    default:         return("UnknownPeriod");
  }
}
Comments