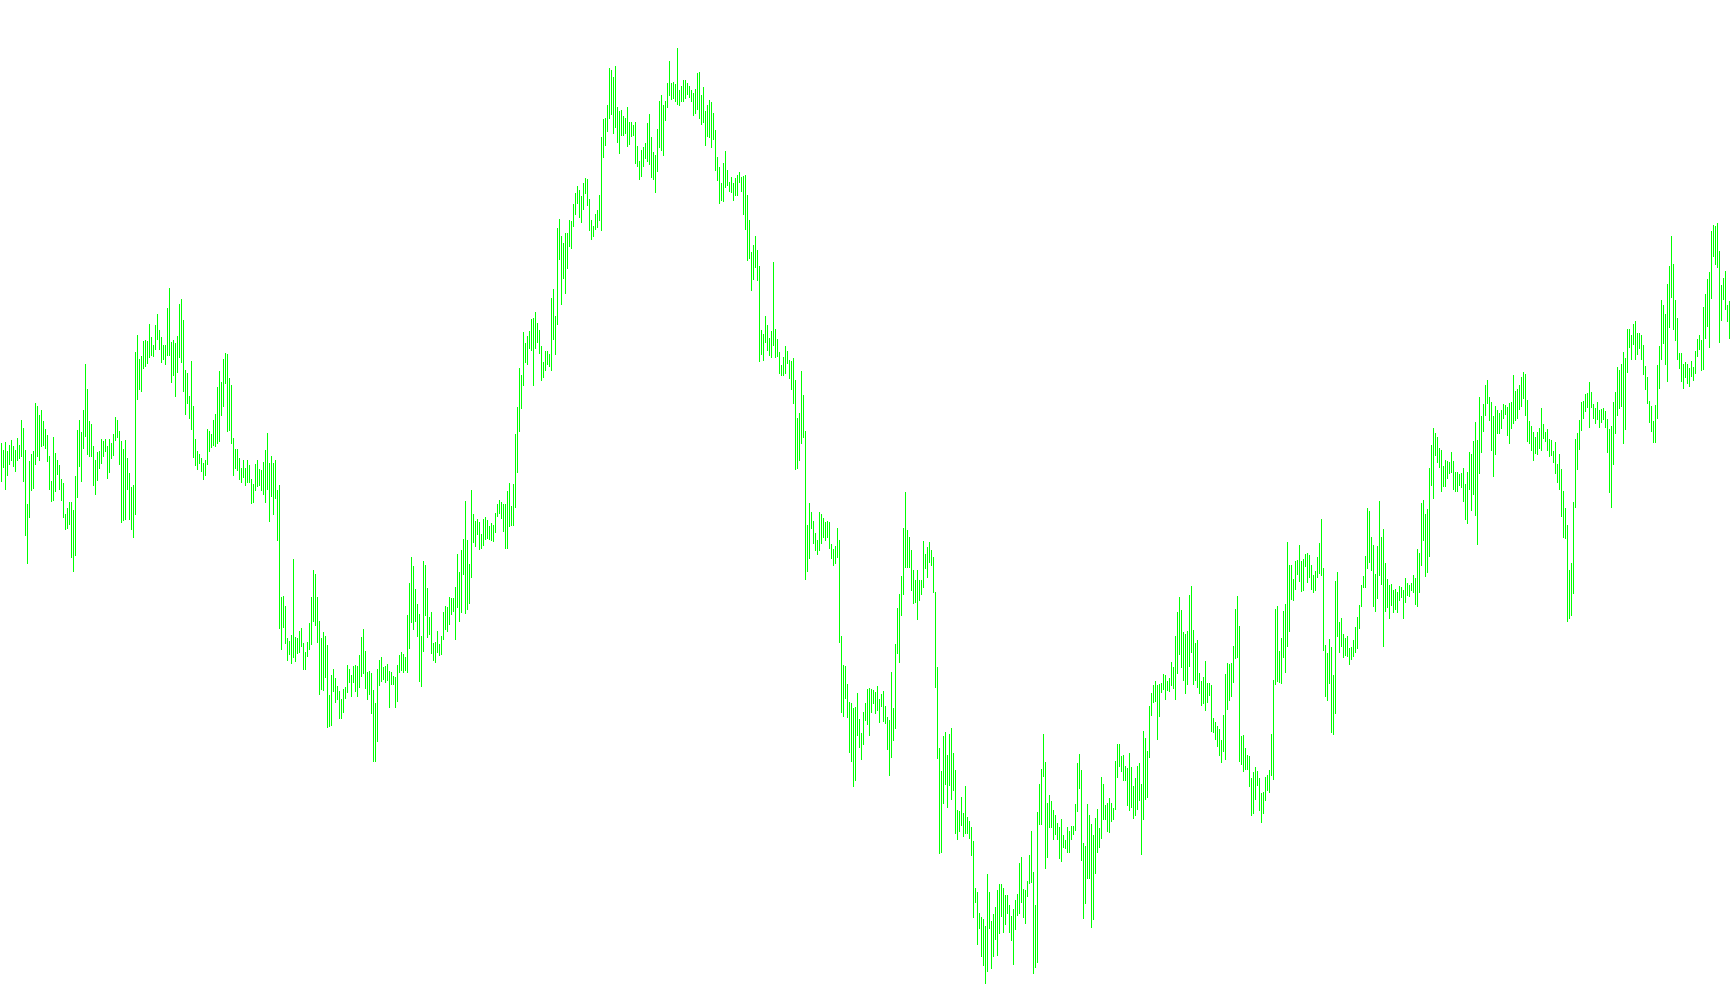
This technical script is designed to provide a visual representation of market trends and price extremes on a trading chart. It works by combining two distinct analytical components: the Parabolic SAR (Stop and Reverse) indicator and a dynamic ZigZag mapping system.
The core logic follows these primary functions:
1. Trend Detection via Parabolic SAR
The script constantly monitors the "Parabolic SAR" values, which are represented as dots on your chart. This component serves as the primary trigger for identifying shifts in market momentum. The script looks for specific "flips" or crossovers where the SAR value moves from one side of the price midpoint to the other, signaling a potential change in direction (from bullish to bearish or vice versa).
2. Price Extremum Identification
While the Parabolic SAR identifies the moment of a trend shift, this script uses that information to pinpoint and "draw" the highest highs and lowest lows reached during that specific trend movement:
- Peaks: When the trend is moving upward, the script tracks the highest price point reached. Once the Parabolic SAR signals a downward flip, the script marks that peak.
- Troughs (Valleys): When the trend is moving downward, the script tracks the lowest price point reached. Once the Parabolic SAR signals an upward flip, the script marks that trough.
3. Smart Positioning Logic
A key feature of this script is how it places these "Peaks" and "Troughs" on the chart:
- Temporal Offset: Instead of just placing a mark at the exact moment a trend reverses (which can sometimes look messy or misaligned), the script includes an option to shift the visual marker.
- Dynamic Adjustment: It can be configured to place the marker either at the specific bar where the reversal was confirmed or at the actual historical peak/valley of the price action. This allows traders to see the "true" structural extremes of the market more clearly.
4. Performance and History Management
To ensure the trading platform remains responsive, the script includes logic to manage data calculation:
- History Limiting: Users can define how far back into the past the indicator should calculate (or set it to analyze the entire available history).
- Update Efficiency: The script is designed to recognize when new bars are forming and only perform necessary calculations, preventing unnecessary strain on your computer's resources.
Summary of Visual Output
When applied to a chart, this script provides a clean visual summary of market structure. It highlights the "swing points" of price action, allowing you to easily see where previous highs and lows were established based on the interaction between price volatility and trend-reversal signals.
#property indicator_chart_window // â îêíå èíñòðóìåíòà
#property indicator_buffers 3
#property indicator_color1 Aqua
#property indicator_color3 Blue
//--âíåøíèå ïåðåìåííûå
extern double Step=0.02; // íà÷àëüíîå çíà÷åíèå è øàã
extern double Maximum=0.2; // êîíå÷íîå çíà÷åíèå

extern bool ExtremumsShift=1; // ïîëîæåíèå ýêñòðåìóìîâ: 0 - ïî âðåìåíè èõ îïðåäåëíèÿ; 1 - ïî èõ ôàêòè÷åñêîìó ïîëîæåíèþ
extern int History=0; // êîë-âî áàðîâ ïðåäûñòîðèè; 0 - âñå

//--
double   Peak[], // áóôåð ZigZag ïî ïèêàì
         Trough[], // áóôåð ZigZag ïî âïàäèíàì
         SAR[]; // áóôåð Parabolic

//=============================================================
int init()
  {
   SetIndexBuffer(0,Peak); // ïèêè
   SetIndexStyle(0,DRAW_ZIGZAG);
   SetIndexLabel(0,"Peak");
   SetIndexEmptyValue(0,0.0);

   SetIndexBuffer(1,Trough); // êðåñòû, ò.å. âïàäèíû)))
   SetIndexStyle(1,DRAW_ZIGZAG);
   SetIndexLabel(1,"Trough");
   SetIndexEmptyValue(1,0.0);

   SetIndexBuffer(2,SAR); // Ïàðàáîëèê
   SetIndexStyle(2,DRAW_ARROW);
   SetIndexArrow(2,159);
   SetIndexLabel(2,"SAR");
   SetIndexEmptyValue(2,0.0);

   return(0);
  }

//=============================================================
int start()
  {
   static int BarsPrev; // çíà÷åíèå Bars íà ïðåä.áàðå
   bool MissBars=Bars-BarsPrev>1; // 1 - åñòü ïðîïóùåííûå áàðû
   bool NewBar=Bars-BarsPrev==1; // 1 - ïåðâûé òèê íóëåâîãî áàðà
   if(MissBars && BarsPrev!=0) BarsPrev=reinit(); // ïðîóùåííûå áàðû â ïðîöåññå - ïåðåñ÷åò çàíîâî

   int limit=Bars-BarsPrev-(BarsPrev==0); BarsPrev=Bars; // êîë-âî ïåðåñ÷åòîâ
   if(History!=0 && limit>History) limit=History-1; // êîë-âî ïåðåñ÷åòîâ ïî èñòîðèè

   for(int i=limit; i>=0; i--) // öèêë ïî íåïîñ÷èòàííûì è ïðåäïîñëåäíåìó áàðàì
     {
      SAR[i]=iSAR(NULL,0,Step,Maximum, i); // Ïàðàáîëèê
      double mid[2]; // ñð. öåíà
      mid[0]=(High[i]+Low[i])/2; // ñð.öåíà íà òåêóùåì áàðå
      mid[1]=(High[i+1]+Low[i+1])/2; // ñð.öåíà íà ïðåä.áàðå

      static int j; // ñ÷åò÷èê ñìåùåíèÿ ìåæäó ìîìåíòîì îïðåäåëåíÿ ýêñòðåìóìà è åãî ïîëîæåíèåì âî âðåìåíè
      static bool dir; // ôëàã íàïðàâëåíèÿ; 0 - âíèç, 1 - ââåðõ
      static double h,l; // òåêóùèå ýêñòðåìàëüíûå çíà÷åíèÿ
      int shift; // ñìåùåíèå ìåæäó ìîìåíòîì îïðåäåëåíÿ ýêñòðåìóìà è åãî ïîëîæåíèåì âî âðåìåíè

      if(i>0) j++; // åñëè áàð çàâåðøåí, òî èíêðåìåíò ñ÷åò÷èêà ñìåùåíèÿ
      if(dir) // ëîâëÿ  ïèêà
        {
         if(h<High[i]) {h=High[i]; j=NewBar;} // òåêóùèé ìàêñèìóì; ñáðîñ ñ÷åò÷èêà ñìåùåíèÿ
         if(SAR[i+1]<=mid[1] && SAR[i]>mid[0]) // ïåðåâîðîò Ïàðàáîëèêà âíèç
           {
            shift=i+ExtremumsShift*(j+NewBar); // ñìåùåíèå
            Peak[shift]=h; // ïèê
            dir=0; // íàïðàâëåíèå âíèç
            l=Low[i]; j=0; // òåêóùèé ìàêñèìóì, ñáðîñ ñ÷åò÷èêà ñìåùåíèÿ
           }
        }
      else // ëîâëÿ âïàäèíû
        {
         if(l>Low[i]) {l=Low[i]; j=NewBar;} // òåêóùèé ìèíèìóì; ñáðîñ ñ÷åò÷èêà ñìåùåíèÿ
         if(SAR[i+1]>=mid[1] && SAR[i]<mid[0]) // ïåðåâîðîò Ïàðàáîëèêà ââåðõ
           {
            shift=i+ExtremumsShift*(j+NewBar); // ñìåùåíèå
            Trough[shift]=l; // âïàäèíà
            dir=1; // íàïðàâëåíèå ââåðõ
            h=High[i]; j=0; // òåêóùèé ìàêñèìóì, ñáðîñ ñ÷åò÷èêà ñìåùåíèÿ
           }
        }
     }

//   if(MissBars) Print("limit: ",limit," Bars:",Bars," IndicatorCounted: ",IndicatorCounted());

   return(0);
  }
//=============================================================

// ô-ÿ äîïîëíèòåëüíîé èíèöèàëèçàöèè
int reinit()
  {
   ArrayInitialize(Peak,0.0);
   ArrayInitialize(Trough,0.0);
   ArrayInitialize(SAR,0.0);
   return(0);
  }
Comments