ZoneTrade_v2.3
Download script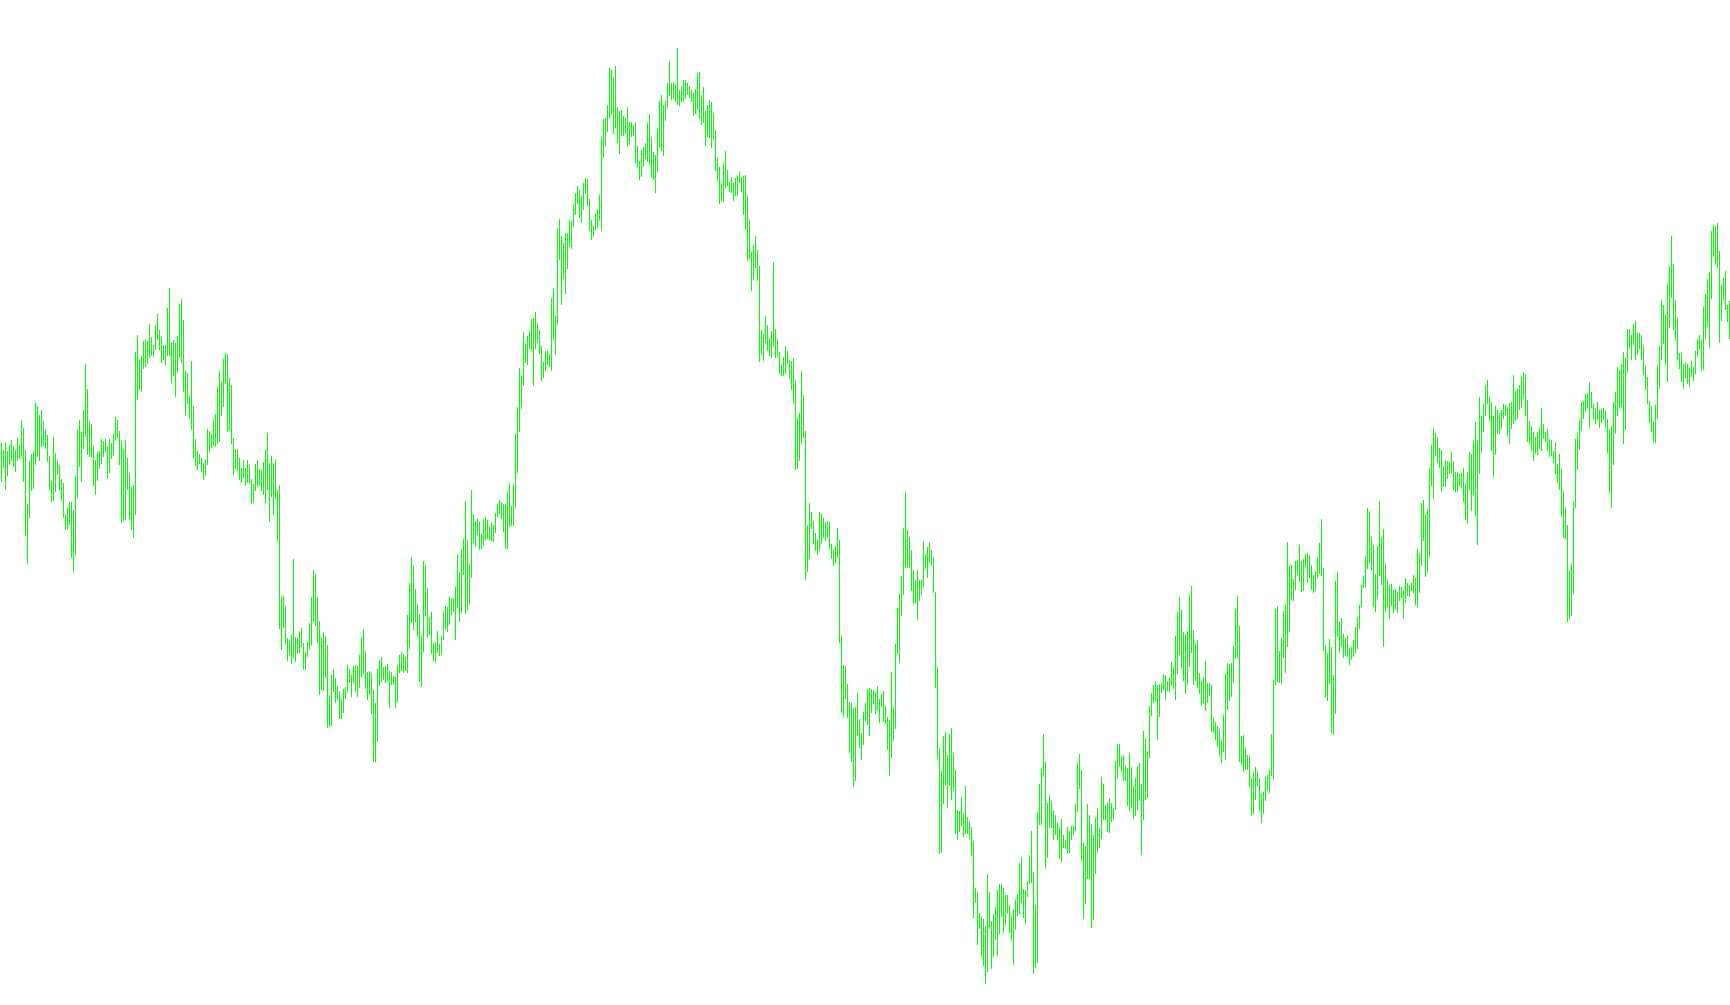
The ZoneTrade script is a visual trading indicator designed to help traders identify specific price action "zones" by analyzing the relationship between two distinct momentum oscillators: the Awesome Oscillator (AO) and the Accelerator Momentum Oscillator (AC).
Instead of just showing you raw lines on a chart, this tool translates the interaction between these two oscillators into color-coded visual zones that appear directly on your price candles. Here is how the logic works:
Core Mechanics
The script continuously monitors the current values of both the AO and AC indicators. By comparing their current levels to their previous values, it determines the "momentum direction" for each. The tool then categorizes the market into three distinct visual states based on whether these two indicators are moving in harmony or opposition.
Visual Categories
The indicator creates three types of zones on your chart:
-
Green Zones (Confluence): These appear when both the AO and AC oscillators move in the same upward direction. The script identifies "Bullish" momentum here. It visually highlights the body of the candle (thick lines) and the outer wicks (thin lines) to show the strength of the current price movement.
-
Red Zones (Opposition): These appear when both indicators move in the same downward direction. This signals "Bearish" momentum. Similar to the green zones, it maps out the high and low points of the candle body and wicks to highlight a clear downward trend.
-
Gray Zones (Neutral/Mixed): These are triggered when the indicators provide conflicting information—for example, if one is moving up while the other is moving down. These areas represent "Mixed" signals or periods of indecision in the market, where momentum is not clearly defined in either direction.
Visual Design
To make these zones easy to read at a glance, the script differentiates between different parts of the price candle:
- Body Thickness: The script uses wider lines to highlight the "Body" of the price candle (the area between the open and close prices).
- Shadow/Wick Thinness: It uses thinner lines to mark the "Shadows" or wicks (the highest and lowest points reached during that period).
By looking at the colors on your chart, you can quickly distinguish between high-confidence momentum (Green/Red) and uncertain market conditions (Gray) without having to manually interpret complex oscillator lines.
//+------------------------------------------------------------------+
//|                                                    ZoneTrade.mq4 |
//|                                                           Duke3D |
//|                                             duke3datomic@mail.ru |
//+------------------------------------------------------------------+
#property copyright "Duke3D"
#property link      "duke3datomic@mail.ru"

#property indicator_chart_window
#property indicator_buffers 8
#property indicator_color1 Green
#property indicator_color2 Red
#property indicator_color3 Gray
#property indicator_color4 Gray
#property indicator_color5 Green
#property indicator_color6 Red
#property indicator_color7 Gray
#property indicator_color8 Gray

#property indicator_width1 3
#property indicator_width2 3
#property indicator_width3 3
#property indicator_width4 3
#property indicator_width5 1
#property indicator_width6 1
#property indicator_width7 1
#property indicator_width8 1

extern color GreenZone        = Green;          // Öâåò çåë¸ííîé çîíû
extern color RedZone          = Red;            // Öâåò êðàñíîé çîíû
extern color GreyZone         = Gray;           // Öâåò ñåðîé çîíû
double AC_0;
double AC_1;
double AO_0;
double AO_1;
string name;
extern int BodyWidth          = 3;              // Øèðèíà òåëà ñâå÷è
extern int ShadowWidth        = 1;              // Øèðèíà òåíè ñâå÷è
//---- buffers
double ExtMapBuffer1[];
double ExtMapBuffer2[];
double ExtMapBuffer3[];
double ExtMapBuffer4[];
double ExtMapBuffer5[];
double ExtMapBuffer6[];
double ExtMapBuffer7[];
double ExtMapBuffer8[];
//----

//+------------------------------------------------------------------+
//| Custom indicator initialization function                         |
//+------------------------------------------------------------------+
int init()
  {
//---- indicators
   SetIndexStyle(0,DRAW_HISTOGRAM, 0, BodyWidth, GreenZone);
   SetIndexBuffer(0, ExtMapBuffer1);

   SetIndexStyle(1,DRAW_HISTOGRAM, 0, BodyWidth, RedZone);
   SetIndexBuffer(1, ExtMapBuffer2);

   SetIndexStyle(2,DRAW_HISTOGRAM, 0, BodyWidth, GreyZone);
   SetIndexBuffer(2, ExtMapBuffer3);

   SetIndexStyle(3,DRAW_HISTOGRAM, 0, BodyWidth, GreyZone);
   SetIndexBuffer(3, ExtMapBuffer4);

   SetIndexStyle(4,DRAW_HISTOGRAM, 0, ShadowWidth, GreenZone);
   SetIndexBuffer(4, ExtMapBuffer5);

   SetIndexStyle(5,DRAW_HISTOGRAM, 0, ShadowWidth, RedZone);
   SetIndexBuffer(5, ExtMapBuffer6);

   SetIndexStyle(6,DRAW_HISTOGRAM, 0, ShadowWidth, GreyZone);
   SetIndexBuffer(6, ExtMapBuffer7);

   SetIndexStyle(7,DRAW_HISTOGRAM, 0, ShadowWidth, GreyZone);
   SetIndexBuffer(7, ExtMapBuffer8);

//----
   SetIndexDrawBegin(0,10);
   SetIndexDrawBegin(1,10);
   SetIndexDrawBegin(2,10);
   SetIndexDrawBegin(3,10);
   SetIndexDrawBegin(4,10);
   SetIndexDrawBegin(5,10);
   SetIndexDrawBegin(6,10);
   SetIndexDrawBegin(7,10);
//---- initialization done
   return(0);
  }
//+------------------------------------------------------------------+
//| Custom indicator deinitialization function                       |
//+------------------------------------------------------------------+
int deinit()
  {
//----
//----
   return(0);
  }
//+------------------------------------------------------------------+
//| Custom indicator iteration function                              |
//+------------------------------------------------------------------+
int start()
  {
   int counted_bars=IndicatorCounted();
   int i, limit;
   double ZTOpen, ZTHigh, ZTLow, ZTClose;

   if(counted_bars > 0) counted_bars--;
   limit = Bars - counted_bars - 1;

   //for(limit=i; limit>0; limit--)
   while(limit>=0)
      {
      ZTOpen  = Open[limit];
      ZTHigh  = High[limit];
      ZTLow   = Low[limit];
      ZTClose = Close[limit];
//===================================================================================================================
      if(IndAC(limit)==1 && IndAO(limit)==1)            // Çåë¸íàÿ çîíà
        {
        if(Open[limit]>Close[limit])                    // bear
          {
           ExtMapBuffer1[limit] = ZTClose;
           ExtMapBuffer2[limit] = ZTOpen;
          }
        if(Open[limit]<Close[limit])                    // bull
          {
           ExtMapBuffer1[limit] = ZTOpen;
           ExtMapBuffer2[limit] = ZTClose;
          }
        ExtMapBuffer5[limit] = ZTLow;
        ExtMapBuffer6[limit] = ZTHigh;

        }
//===================================================================================================================
      if(IndAC(limit)==2 && IndAO(limit)==2)            // Êðàñíàÿ çîíà
        {
        if(Open[limit]>Close[limit])                    // bear
          {
           ExtMapBuffer1[limit] = ZTOpen;
           ExtMapBuffer2[limit] = ZTClose;
          }
        if(Open[limit]<Close[limit])                    // bull
          {
           ExtMapBuffer1[limit] = ZTClose;
           ExtMapBuffer2[limit] = ZTOpen;
          }
        ExtMapBuffer5[limit] = ZTHigh;
        ExtMapBuffer6[limit] = ZTLow;
        }
//===================================================================================================================
      if((IndAC(limit)==1 && IndAO(limit)==2) || (IndAC(limit)==2 && IndAO(limit)==1))            // Ñåðàÿ çîíà
        {
        if(Open[limit]>Close[limit])                    // bear
          {
           ExtMapBuffer3[limit] = ZTClose;
           ExtMapBuffer4[limit] = ZTOpen;
          }
        if(Open[limit]<Close[limit])                    // bull
          {
           ExtMapBuffer3[limit] = ZTOpen;
           ExtMapBuffer4[limit] = ZTClose;
          }
        ExtMapBuffer7[limit] = ZTLow;
        ExtMapBuffer8[limit] = ZTHigh;
        }
      limit--;
      }
//===================================================================================================================
  return(0);
  }
//===================================================================================================================
int IndAC(int Shift)
   {
   int DirectionAC;
   AC_0 = iAC(Symbol(),0,Shift);
   AC_1 = iAC(Symbol(),0,Shift-1);
   if(AC_0>AC_1) {DirectionAC = 1;}               // Çåë¸íûé áàð
   if(AC_0<AC_1) {DirectionAC = 2;}               // Êðàñíûé áàð
   return(DirectionAC);
   }
//===================================================================================================================
int IndAO(int Shift)
   {
   int DirectionAO;
   AO_0 = iAO(Symbol(),0,Shift);
   AO_1 = iAO(Symbol(),0,Shift-1);
   if(AO_0>AO_1) {DirectionAO = 1;}               // Çåë¸íûé áàð
   if(AO_0<AO_1) {DirectionAO = 2;}               // Êðàñíûé áàð
   return(DirectionAO);
   }
//===================================================================================================================
Comments