ZZ_pS_v[1].0.4
Download script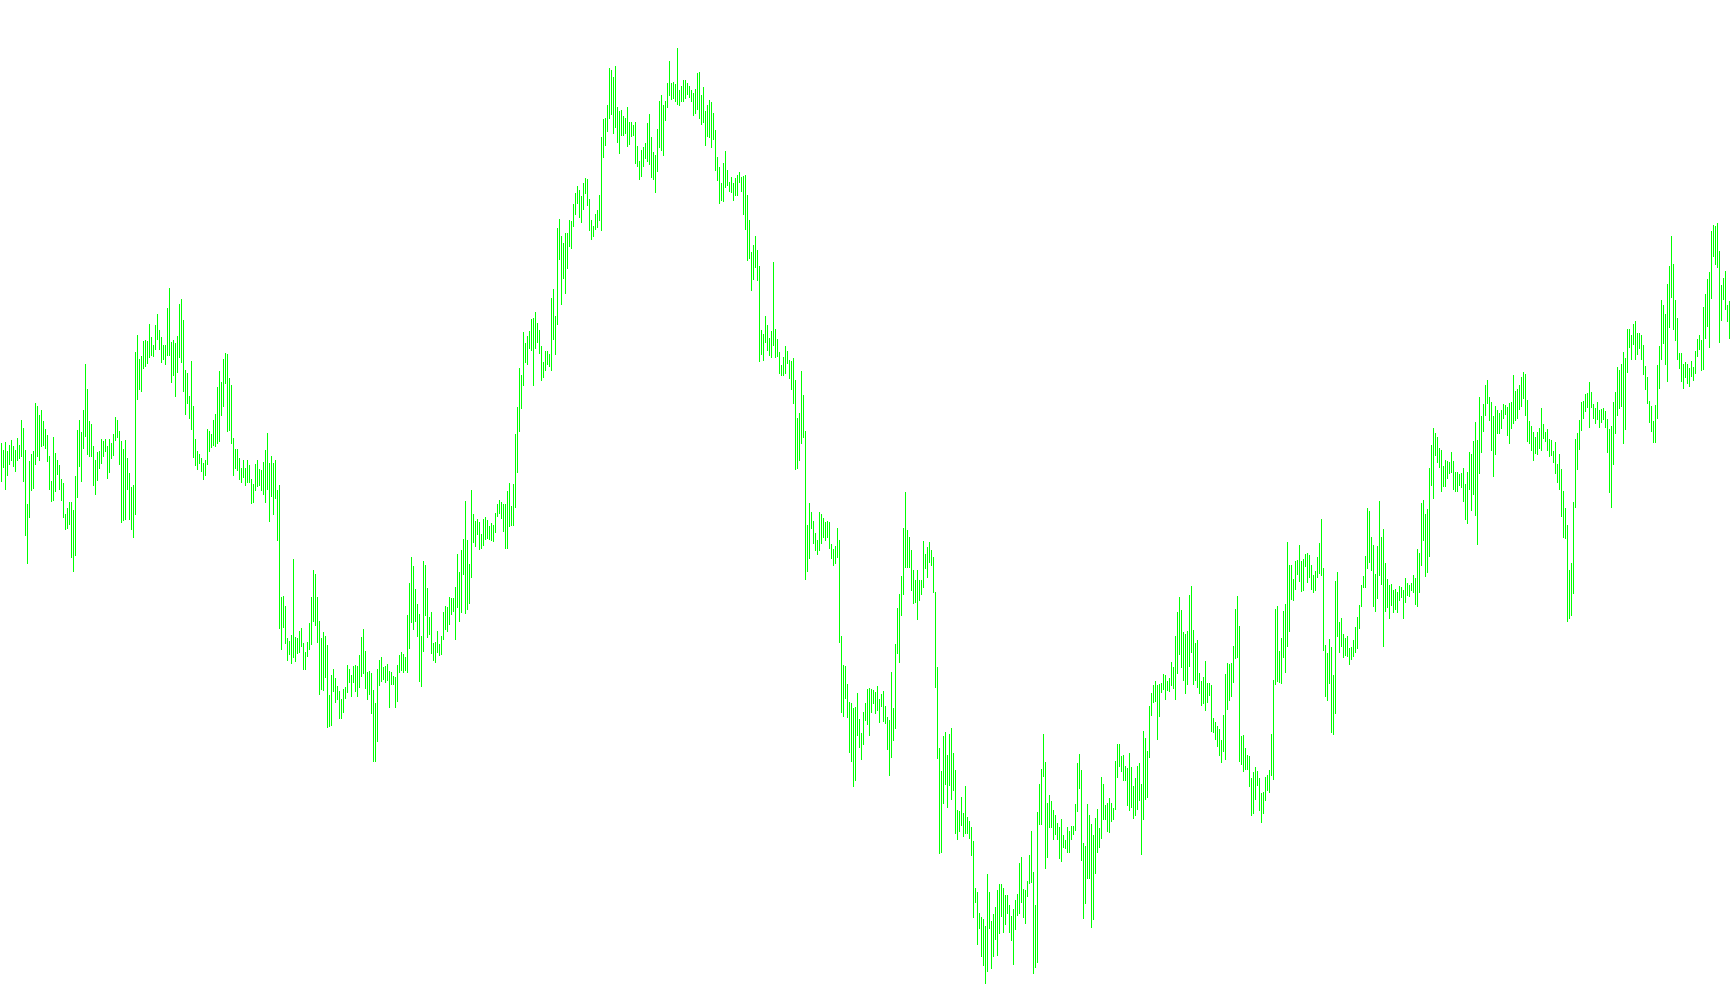
This script is a specialized technical analysis tool designed to identify and visualize specific price movements and trend reversals on a trading chart. It works by interpreting the underlying "zigzag" patterns of the market—which are the structural highs and lows that define a trend—and converting those movements into visual signals.
Core Logic Overview
The tool operates through a three-step process: data collection, signal classification, and visual mapping.
1. Data Collection & Comparison The script begins by looking at historical price data over a user-defined period (defaulting to 300 bars). It pulls information from external zigzag indicators to determine whether the current price point represents a significant "swing" high or low. Depending on your settings, it chooses between different methods of calculating these swings to ensure accuracy relative to your trading style.
2. Movement Classification Once the script identifies a swing point, it classifies the direction of the market:
- If the swing occurs at a price Low, it flags a downward movement.
- If the swing occurs at a price High, it flags an upward movement. The script stores these classifications as binary markers, creating a map of "up" and "down" movements over time.
3. Pattern Recognition & Visualization This is where the script performs its most complex task. It scans through the identified markers to detect specific sequences of price action. Instead of just showing you every high and low, it looks for transitions between them:
- Trend Confirmation: It detects when a movement has successfully shifted direction and creates visual indicators (lines and arrows) to highlight these milestones.
- Intensity Scaling: The script uses different numerical values to represent the "strength" or "position" of a move. These values translate into specific visual outputs on your screen, such as different colors (Lime Green for bullish actions and Orange Red for bearish actions).
- Dynamic Mapping: By analyzing the relationship between the current bar and the preceding bars, the script determines exactly where to place arrows and lines. It ensures that signals are only drawn when a specific structural change in price occurs, helping to filter out market "noise."
User Experience Summary
For the end user, this logic results in a clean, visual representation of market structure. Rather than forcing you to manually trace every peak and valley, the script automatically interprets the data and places visual markers (arrows and lines) on your chart to highlight significant structural shifts, helping you identify potential trend reversals or continuations at a glance.
//+------------------------------------------------------------------+
//|                                                                  |
//|                                                                  |
//|                                                                  |
//+------------------------------------------------------------------+
#property copyright "Copyright © 2005, MetaQuotes Software Corp."
#property link      "http://www.metaquotes.net/"

#property indicator_separate_window
#property indicator_minimum -100
#property indicator_maximum 100
#property indicator_buffers 4
#property indicator_color1 LimeGreen
#property indicator_color2 OrangeRed
#property indicator_color3 LimeGreen
#property indicator_color4 OrangeRed
//---- indicator parameters
extern int ExtDepth=12;
extern int minBars = 2;
extern int nBars=300;
extern int ZZ_Method=0;
//---- indicator buffers
double ExtMapBuffer3[];
double ExtMapBuffer4[];
double ExtMapBuffer5[];
double ExtMapBuffer6[];
double zz[];
//+------------------------------------------------------------------+
//| Custom indicator initialization function                         |
//+------------------------------------------------------------------+
int init()
  {
   IndicatorBuffers(5);
//---- drawing settings
   SetIndexStyle(0,DRAW_ARROW);
   SetIndexArrow(0,119);
   SetIndexBuffer(0,ExtMapBuffer3);
   SetIndexEmptyValue(0,0.0);
   SetIndexLabel(0,"Points_Up");
   SetIndexStyle(1,DRAW_ARROW);
   SetIndexArrow(1,119);
   SetIndexBuffer(1,ExtMapBuffer4);
   SetIndexEmptyValue(1,0.0);
   SetIndexLabel(1,"Points_Dn");
   SetIndexStyle(2,DRAW_LINE);
   SetIndexBuffer(2,ExtMapBuffer5);
   SetIndexEmptyValue(2,0.0);
   SetIndexLabel(2,"Line_Up");
   SetIndexStyle(3,DRAW_LINE);
   SetIndexBuffer(3,ExtMapBuffer6);
   SetIndexEmptyValue(3,0.0);
   SetIndexLabel(3,"Line_Dn");
//---- indicator buffers mapping
   SetIndexBuffer(4,zz);
//---- indicator short name
   IndicatorShortName("ZZ_pS");
//---- initialization done
   return(0);
  }
//+------------------------------------------------------------------+
//|                                                                  |
//+------------------------------------------------------------------+
int deinit()
  {
//----
   return(0);
  }
//+------------------------------------------------------------------+
//|                                                                  |
//+------------------------------------------------------------------+
int start()
  {
   int shift;
   bool signal;
   double extzigzag;
//----
   if(nBars>Bars || nBars==0) nBars=Bars;
//----
   ArrayInitialize(ExtMapBuffer3,0.0);
   ArrayInitialize(ExtMapBuffer4,0.0);
   ArrayInitialize(ExtMapBuffer5,0.0);
   ArrayInitialize(ExtMapBuffer6,0.0);
   ArrayInitialize(zz,0.0);
//----
   for(shift=nBars-1; shift>=0; shift--)
    {
     if(ZZ_Method==0) extzigzag=iCustom(NULL,0,"DT_ZZ",ExtDepth,0,shift);
     else extzigzag=iCustom(NULL,0,"Swing_ZZ",minBars,0,shift);
     if(extzigzag==Low[shift]) signal=true;
     if(extzigzag==High[shift]) signal=false;
     if (signal) zz[shift]=-1;
     else zz[shift]=1;
    }
//----
   for(shift=nBars-3; shift>=0; shift--)
     {
      if (zz[shift]<0)
        {
         if (zz[shift+2]>0)
           {
            if (zz[shift+1]>0)
              {
               ExtMapBuffer4[shift+1]=-70;
               ExtMapBuffer6[shift+1]=-70;
               ExtMapBuffer3[shift+1]=0.0;
               ExtMapBuffer5[shift+1]=0.0;
               ExtMapBuffer4[shift]=-90;
               ExtMapBuffer6[shift]=-90;
               ExtMapBuffer3[shift]=-90;
               ExtMapBuffer5[shift]=-90;
              }
            else
            if (zz[shift+1]<0)
              {
               ExtMapBuffer3[shift]=-30;
               ExtMapBuffer5[shift]=-30;
               ExtMapBuffer4[shift]=0.0;
               ExtMapBuffer6[shift]=0.0;
              }
           }
         else
         if (zz[shift+2]<0)
           {
            if (zz[shift+1]>0)
              {
               ExtMapBuffer3[shift]=-90;
               ExtMapBuffer5[shift]=-90;
               ExtMapBuffer4[shift]=-90;
               ExtMapBuffer6[shift]=-90;
              }
            else
            if (zz[shift+1]<0)
              {
               ExtMapBuffer3[shift]=0.001;
               ExtMapBuffer5[shift]=0.001;
               ExtMapBuffer4[shift]=0.0;
               ExtMapBuffer6[shift]=0.0;
              }
           }
        }
      else
      if (zz[shift]>0)
        {
         if (zz[shift+2]>0)
           {
            if (zz[shift+1]>0)
              {
               ExtMapBuffer4[shift]=0.001;
               ExtMapBuffer6[shift]=0.001;
               ExtMapBuffer3[shift]=0.0;
               ExtMapBuffer5[shift]=0.0;
              }
            else
            if (zz[shift+1]<0)
              {
               ExtMapBuffer3[shift]=90;
               ExtMapBuffer5[shift]=90;
               ExtMapBuffer4[shift]=90;
               ExtMapBuffer6[shift]=90;
              }
           }
         else
         if (zz[shift+2]<0)
           {
            if (zz[shift+1]>0)
              {
               ExtMapBuffer4[shift]=30;
               ExtMapBuffer6[shift]=30;
               ExtMapBuffer3[shift]=0.0;
               ExtMapBuffer5[shift]=0.0;
              }
            else
            if (zz[shift+1]<0)
              {
               ExtMapBuffer3[shift+1]=70;
               ExtMapBuffer5[shift+1]=70;
               ExtMapBuffer4[shift+1]=0.0;
               ExtMapBuffer6[shift+1]=0.0;
               ExtMapBuffer3[shift]=90;
               ExtMapBuffer5[shift]=90;
               ExtMapBuffer4[shift]=90;
               ExtMapBuffer6[shift]=90;
              }
           }
        }
     }
//----
   return(0);
  }
//+------------------------------------------------------------------+
Comments