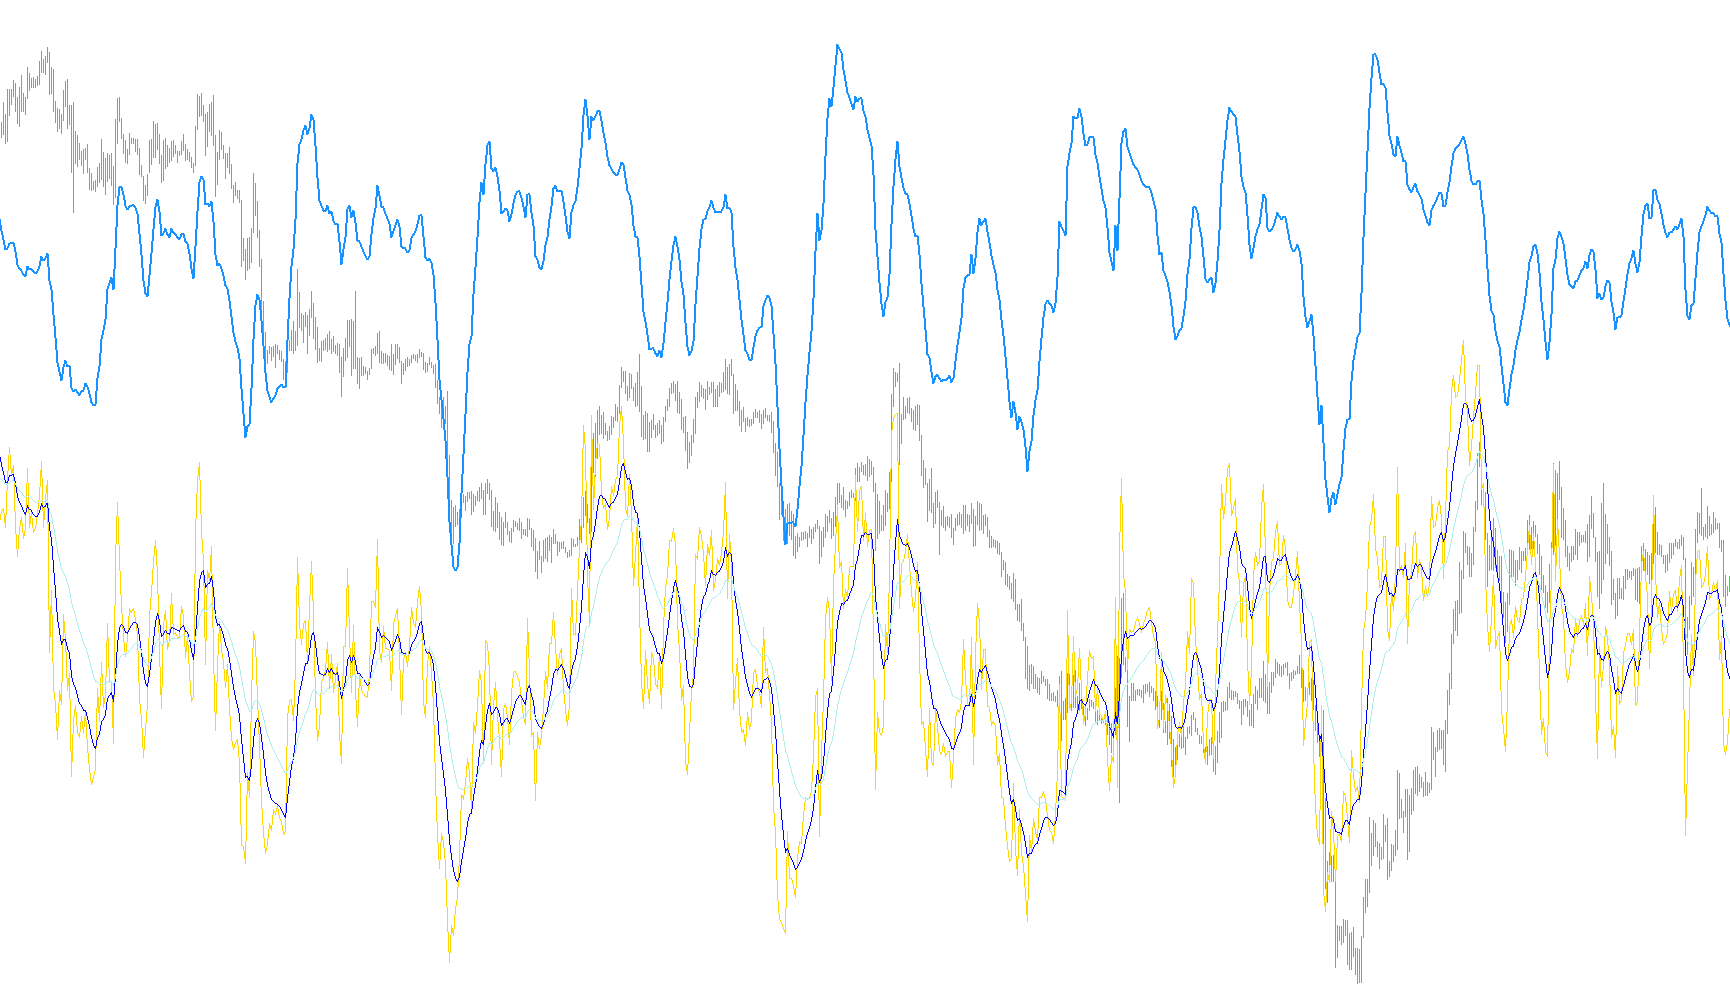
This technical tool is designed to provide traders with a multi-layered analysis of market momentum by combining traditional relative strength indicators with moving average smoothing. Instead of looking at price alone, this script calculates how the "strength" of a currency pair or asset behaves over time, offering a clearer picture of trend direction and potential exhaustion.
Core Logic & Components
The tool operates through a three-step calculation process to transform raw market data into actionable visual information:
1. Momentum Tracking (RSI) At its foundation, the script calculates the Relative Strength Index (RSI). This measures the speed and change of price movements. A key feature of this specific logic is its "Multi-Time Frame" capability, which allows it to pull momentum data from different time periods (e.g., looking at hourly trends while viewing a 15-minute chart) to ensure that short-term actions are understood within the context of the larger market trend.
2. Trend Smoothing (Moving Averages) Rather than analyzing the raw RSI values—which can be volatile and "noisy"—the script applies two different Moving Averages (MA10 and MA30) directly onto the RSI data itself.
- The faster moving average reacts quickly to immediate changes in momentum.
- The slower moving average identifies the broader, long-term trend of that momentum.
3. The Momentum Ratio The final and most unique layer of this logic is the "Ratio." The script divides the fast moving average by the slow moving average and converts it into a percentage. This provides a distinct visual representation of:
- Momentum Acceleration: When the ratio moves significantly above 100, it indicates that short-term momentum is gaining strength rapidly compared to the long-term trend.
- Momentum Deceleration: When the ratio drops toward or below 100, it suggests that the immediate buying or selling pressure is beginning to cool off or reverse.
Visual Summary
The indicator provides four distinct visual elements in a separate window:
- RSI Line: The raw momentum value.
- MA1 & MA2: The smoothed trend lines of that momentum.
- Ratio Line: A specific calculation showing the mathematical relationship between the two averages, helping traders identify the intensity of the current price movement relative to its historical average.
//+--------------------------------------------------------------+
//|                                                      MoR.mq4 |
//+--------------------------------------------------------------+
//mod2008fxtsd mtf
#property copyright "Wolfe"
#property link "xxxxwolfe@gmail.com"

#property indicator_separate_window
#property indicator_level1  100
#property indicator_level2  80
#property indicator_level3  50
#property indicator_level4  20
#property indicator_buffers 4
#property indicator_color1 Black    //RSI
#property indicator_color2 Blue     //MA1
#property indicator_color3 Red      //MA2
#property indicator_color4 Green    //Ratio

extern int  RSI_TimeFrame=0;//0=current chart,1=m1,5=m5,15=m15,30=m30,60=h1,240=h4,etc...
extern int  RSI_Period = 10;
extern int  RSI_Applied_Price = 0;//0=close, 1=open, 2=high, 3=low, 4=(high+low)/2, 5=(high+low+close)/3, 6=(high+low+close+close)/4
extern int  MA1_Period = 10;
extern int  MA1_Method = 1;// 0=SMA, 1=EMA, 2=SMMA, 3=LWMA
extern int  MA2_Period = 30;
extern int  MA2_Method = 1;// 0=SMA, 1=EMA, 2=SMMA, 3=LWMA

double RSI[],RSI1[],MA1_Array[],MA2_Array[],MR_Ratio[];

//+------------------------------------------------------------------+
//| Custom indicator initialization function |
//+------------------------------------------------------------------+
int init()
{
//---- indicators setting
SetIndexStyle(0,DRAW_LINE,STYLE_SOLID,1); //RSI
SetIndexStyle(1,DRAW_LINE,STYLE_SOLID,1); //EMA10
SetIndexStyle(2,DRAW_LINE,STYLE_SOLID,1); //EMA30
SetIndexStyle(3,DRAW_LINE,STYLE_SOLID,2); //Ratio

IndicatorBuffers(5);

SetIndexBuffer(0,RSI);
SetIndexLabel(0,"RSI");

SetIndexBuffer(1,MA1_Array);
SetIndexLabel(1,"MA1");

SetIndexBuffer(2,MA2_Array);
SetIndexLabel(2,"MA2");

SetIndexBuffer(3,MR_Ratio);
SetIndexLabel(3,"Ratio");

SetIndexBuffer(4,RSI1);


IndicatorDigits(MarketInfo(Symbol(),MODE_DIGITS));
IndicatorShortName("MoR");

return(0);
}

//+------------------------------------------------------------------+
//| Custom indicator iteration function |
//+------------------------------------------------------------------+
int start()
{
   int  counted_bars=IndicatorCounted();
   int  i,y,limit;

   if (counted_bars<0) return(-1);
   if (counted_bars>0) counted_bars--;
         limit=Bars-counted_bars;

   //+------------------------------------------------------------------+
   //| RSI |RSI_Timeframe
   //+------------------------------------------------------------------+
 //  for(i=limit; i>=0; i--){

    datetime TimeArray[],TimeArray1[];

   ArrayCopySeries(TimeArray,MODE_TIME,Symbol(),RSI_TimeFrame);
   ArrayCopySeries(TimeArray1,MODE_TIME,Symbol(),RSI_TimeFrame);

limit = Bars-counted_bars;
limit = MathMax (limit,RSI_TimeFrame/Period());

   for(i=0,y=0;i<limit;i++)
   {
   if (Time[i]<TimeArray[y]) y++;


      RSI[i]= iRSI(NULL,RSI_TimeFrame,RSI_Period,RSI_Applied_Price,y);

      RSI1[y]  = RSI[i];
    }

   //+------------------------------------------------------------------+
   //| EMA 10 & 30 |
   //+------------------------------------------------------------------+
   for(y=0,i=0; i<limit; i++)
     {
      if (Time[i]<TimeArray1[y]) y++;

      MA1_Array[i] = iMAOnArray(RSI1,0,MA1_Period,0,MA1_Method,y);
      MA2_Array[i] = iMAOnArray(RSI1,0,MA2_Period,0,MA2_Method,y);

   //+------------------------------------------------------------------+
   //| Ratio of EMA 10 & 30 |
   //+------------------------------------------------------------------+

      if (MA2_Array[i]!=0)
      MR_Ratio[i] = MA1_Array[i] / MA2_Array[i] * 100;
      }

   //----
   return(0);
}
Comments