10Min_011a_v1
Download script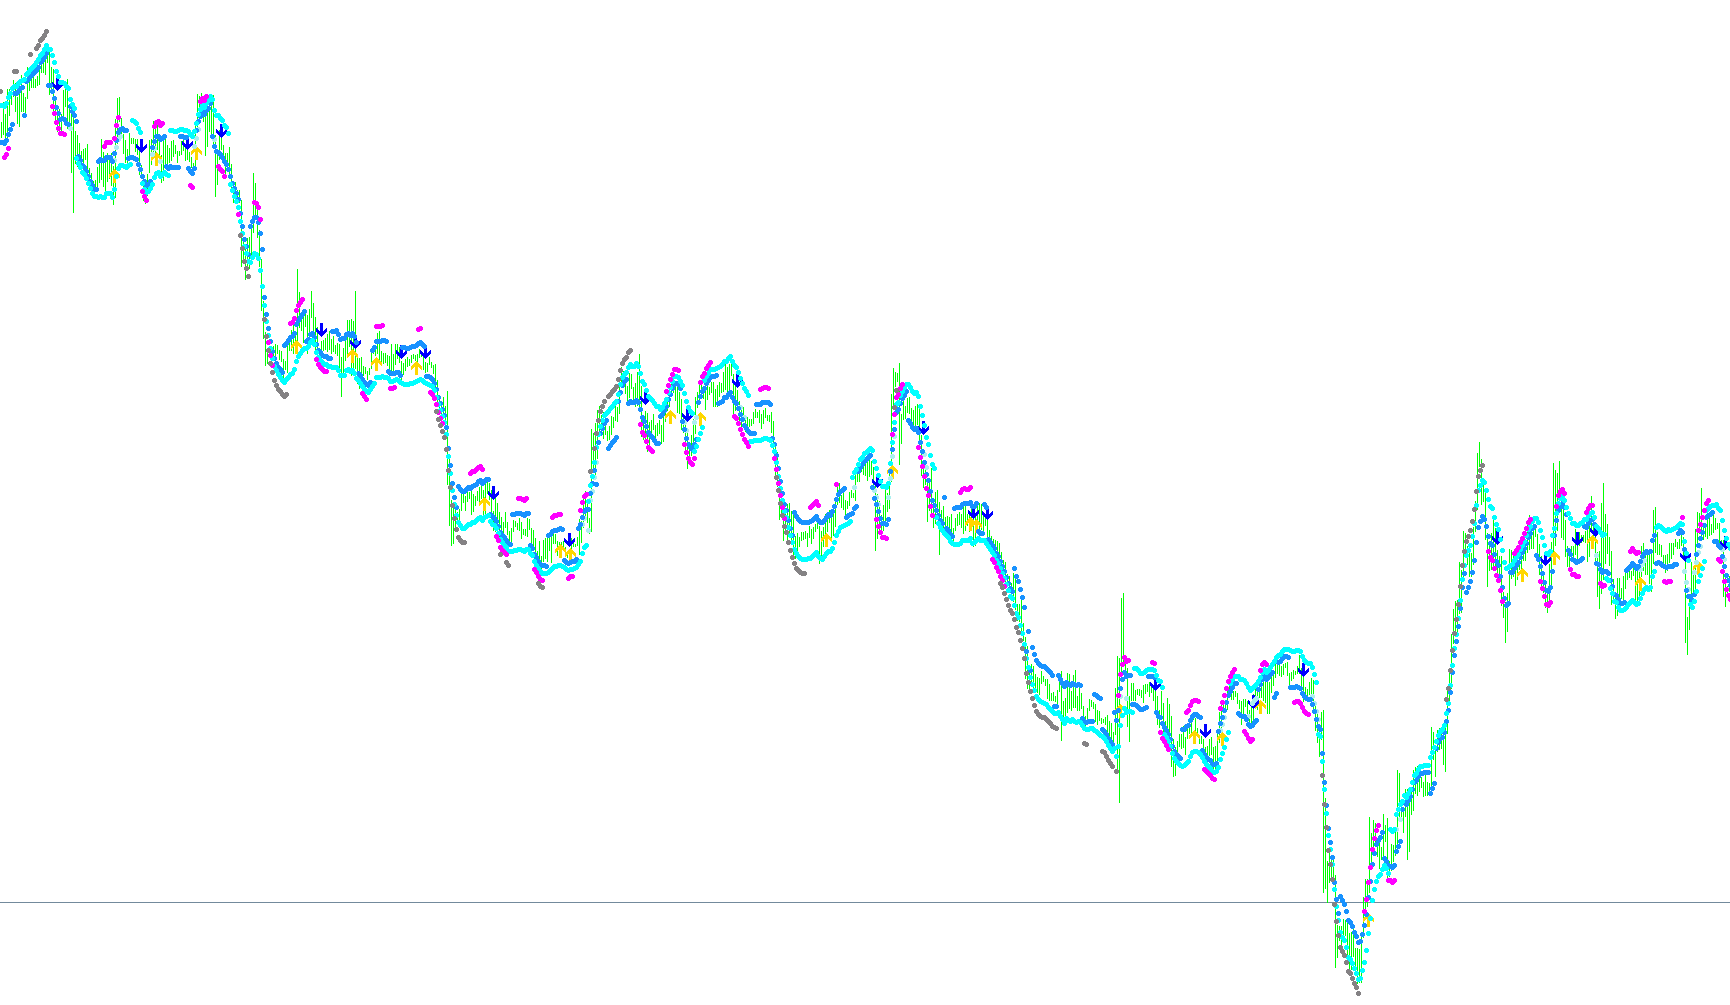
This technical indicator is designed to provide visual trading signals on a MetaTrader chart by analyzing multiple market conditions simultaneously. Instead of relying on a single data point, it combines five distinct technical analysis methods to identify potential momentum shifts and trend reversals.
Core Logic and Methodology
The script functions by monitoring several key market indicators and "plotting" specific symbols (arrows and dots) on your chart when certain mathematical conditions are met. It evaluates the following components:
- Moving Average Crossovers: The script compares a fast-moving weighted average against a slower simple moving average. When these two lines cross each other, it signals a change in the primary trend (upward or downward).
- Relative Strength Index (RSI) Momentum: It monitors price strength relative to its recent past. By looking at "chains" of previous RSI values, the script identifies significant shifts where the market moves from a weakened state to a strengthened state (or vice versa).
- Stochastic Oscillator Analysis: The tool calculates the relationship between the current price and its range over a set period. It looks for specific gaps between the "Main" and "Signal" lines of the Stochastic indicator to detect overbought or oversold conditions.
- MACD (Moving Average Convergence Divergence): It monitors the signal line of the MACD to determine the immediate direction of price momentum, helping to filter out "noise" in the market.
How the Signals Work
The script translates these complex calculations into visual cues on your screen:
- Trend Identification: It uses arrows to highlight when moving averages cross, indicating a potential shift in the broader market direction.
- Momentum Confirmation: It utilizes various markers (dots and different colored arrows) to signal specific high-probability setups, such as when RSI strength aligns with Stochastic overbought/oversold levels.
- Multi-Factor Filtering: By requiring several conditions to be met at once—such as a specific RSI threshold combined with a specific Stochastic level—the script aims to provide more filtered signals than a standard indicator would offer on its own.
User Experience
For the trader, this means you do not have to manually calculate these five different indicators. The script does the heavy lifting in the background, scanning the historical data and real-time price action to place visual markers directly on your chart, highlighting potential entries and exits based on a multi-layered confirmation strategy.
/*-----------------------------+
|			       |
| Shared by www.Aptrafx.com    |
|			       |
+------------------------------*/

//+------------------------------------------------------------------+
//| 10 Minute trader                                                 |
//+------------------------------------------------------------------+
#property copyright "Ron T"
#property link      "http://www.lightpatch.com"

#property indicator_chart_window
#property indicator_buffers 7
#property indicator_color1 HotPink  // arrow up
#property indicator_color2 HotPink  // arrow down
#property indicator_color3 Aqua
#property indicator_color4 Red
#property indicator_color5 White
#property indicator_color6 HotPink
#property indicator_color7 LimeGreen

//---- buffers
double ExtMapBuffer1[];
double ExtMapBuffer2[];
double ExtMapBuffer3[];
double ExtMapBuffer4[];
double ExtMapBuffer5[];
double ExtMapBuffer6[];
double ExtMapBuffer7[];


// User Input


//+------------------------------------------------------------------+
//| Custom indicator initialization function                         |
//|------------------------------------------------------------------|

int init()
  {

   // 233 up arrow
   // 234 down arrow
   // 159 big dot
   // 168 open square

   SetIndexStyle(0,DRAW_ARROW);
   SetIndexBuffer(0, ExtMapBuffer1);
   SetIndexArrow(0,233);  //up

   SetIndexStyle(1,DRAW_ARROW);
   SetIndexBuffer(1, ExtMapBuffer2);
   SetIndexArrow(1,234);  //down

   SetIndexStyle(2,DRAW_ARROW);
   SetIndexBuffer(2, ExtMapBuffer3);
   SetIndexArrow(2,159);

   SetIndexStyle(3,DRAW_ARROW);
   SetIndexBuffer(3, ExtMapBuffer4);
   SetIndexArrow(3,159);

   SetIndexStyle(4,DRAW_ARROW);
   SetIndexBuffer(4, ExtMapBuffer5);
   SetIndexArrow(4,159);

   SetIndexStyle(5,DRAW_ARROW);
   SetIndexBuffer(5, ExtMapBuffer6);
   SetIndexArrow(5,159);

   SetIndexStyle(6,DRAW_ARROW);
   SetIndexBuffer(6, ExtMapBuffer7);
   SetIndexArrow(6,159);

   return(0);
  }


//+------------------------------------------------------------------+
//| Custor indicator deinitialization function                       |
//+------------------------------------------------------------------+
int deinit()
  {
   int i;

   for( i=0; i<Bars; i++ ) ExtMapBuffer1[i]=0;
   for( i=0; i<Bars; i++ ) ExtMapBuffer2[i]=0;
   for( i=0; i<Bars; i++ ) ExtMapBuffer3[i]=0;
   for( i=0; i<Bars; i++ ) ExtMapBuffer4[i]=0;
   for( i=0; i<Bars; i++ ) ExtMapBuffer5[i]=0;
   for( i=0; i<Bars; i++ ) ExtMapBuffer6[i]=0;
   for( i=0; i<Bars; i++ ) ExtMapBuffer7[i]=0;

   return(0);
  }


//+------------------------------------------------------------------+
//| Custom indicator iteration function                              |
//+------------------------------------------------------------------+
int start()
  {
   double    wma=0,    wma_p=0;  // linear Weighted Moving Average & Previous
   double    sma=0,    sma_p=0;  // Simple Moving Average & Previous
   double stochm=0;              // STOCHastic Main
   double stochm1=0, stochm2=0;  // long chain stochm 1&2
   double stochm3=0, stochm4=0;  // long chain stochm 3&4
   double stochs=0;              // STOCHastic Signal
   double stochs1=0, stochs2=0;  // long chain stochs 1&2
   double stochs3=0, stochs4=0;  // long chain stochs 3&4
   double  macdm=0;              // Moving Average Convergance Divergance Main
   double  macds=0;              // Moving Average Convergance Divergance Signal
   double    rsi=0;              // Relative Strength Indicator
   double   rsi1=0,     rsi2=0;  // long chain rsi 1&2
   double   rsi3=0,     rsi4=0;  // long chain rsi 3&4

   int pos=Bars-100;             // leave room for moving average periods

   while(pos>=0)
     {

      wma_p=wma; // save previous calculations
      wma=iMA(Symbol(),0,10,0,MODE_LWMA,PRICE_CLOSE,pos);

      sma_p=sma; // save previous calculations
      sma=iMA(Symbol(),0,20,0,MODE_SMA,PRICE_CLOSE,pos);

      stochs=iStochastic(Symbol(),0,10,6,6,0,1,1,pos);
      stochs=iStochastic(Symbol(),0,10,6,6,0,1,1,pos+1);
      stochs=iStochastic(Symbol(),0,10,6,6,0,1,1,pos+2);
      stochs=iStochastic(Symbol(),0,10,6,6,0,1,1,pos+3);
      stochs=iStochastic(Symbol(),0,10,6,6,0,1,1,pos+4);

      stochm=iStochastic(Symbol(),0,10,6,6,0,1,0,pos);
      stochm1=iStochastic(Symbol(),0,10,6,6,0,1,0,pos+1);
      stochm2=iStochastic(Symbol(),0,10,6,6,0,1,0,pos+2);
      stochm3=iStochastic(Symbol(),0,10,6,6,0,1,0,pos+3);
      stochm4=iStochastic(Symbol(),0,10,6,6,0,1,0,pos+4);

      rsi=iRSI(Symbol(),0,28,PRICE_CLOSE,pos);
      rsi1=iRSI(Symbol(),0,28,PRICE_CLOSE,pos+1);
      rsi2=iRSI(Symbol(),0,28,PRICE_CLOSE,pos+2);
      rsi3=iRSI(Symbol(),0,28,PRICE_CLOSE,pos+3);
      rsi4=iRSI(Symbol(),0,28,PRICE_CLOSE,pos+4);

      macdm=iMACD(Symbol(),0,12,26,9,0,0,pos);
      macds=iMACD(Symbol(),0,12,26,9,0,1,pos);

      // RISING stochastic cross
      // if (stochm1>stochm && stochs1<stochs && stochs>stochm)

      // FALLING stochastic cross
      // if (stochm1<stochm && stochs1>stochs && stochs<stochm)


      if ( wma_p < sma_p && wma > sma )                                // MA crossed up
        {
         ExtMapBuffer1[pos]=wma - 0.0003;
        }
      if (rsi > 52 && ( rsi1<48 || rsi2<48 || rsi3<48 || rsi4<48 ) )   //blue
        {
         ExtMapBuffer3[pos]=wma + 0.0003;
        }
      if (stochm>stochs)                                               //red
        {
         ExtMapBuffer4[pos]=wma + 0.0006;
        }
      if (macds > 0)                                                   //white
        {
         ExtMapBuffer5[pos]=wma + 0.0009;
        }
      if (stochm-stochs>30)                                            //hotpink
        {
         ExtMapBuffer6[pos]=wma + 0.0012;
        }


      if ( wma_p > sma_p && wma < sma )
        {
         ExtMapBuffer2[pos]=wma + 0.0003;
        }
      if (rsi < 48 && ( rsi1>52 || rsi2>52 || rsi3>52 || rsi4>52 ) )
        {
         ExtMapBuffer3[pos]=wma - 0.0003;
        }
      if (stochm < stochs)
        {
         ExtMapBuffer4[pos]=wma - 0.0006;
        }
      if (macds < 0)
        {
         ExtMapBuffer5[pos]=wma - 0.0009;
        }
      if (stochm-stochs<-30)                                            //hotpink
        {
         ExtMapBuffer6[pos]=wma - 0.0012;
        }

      if ( rsi>60 && stochm>80 )
        {
          ExtMapBuffer7[pos]=wma + 0.0015;
        }

      if ( rsi<40 && stochm<20 )   //white dot
        {
          ExtMapBuffer7[pos]=wma - 0.0015;
        }

 	   pos--;
     }

   return(0);
  }
//+------------------------------------------------------------------+
Comments