2rsi-01_v1
Download script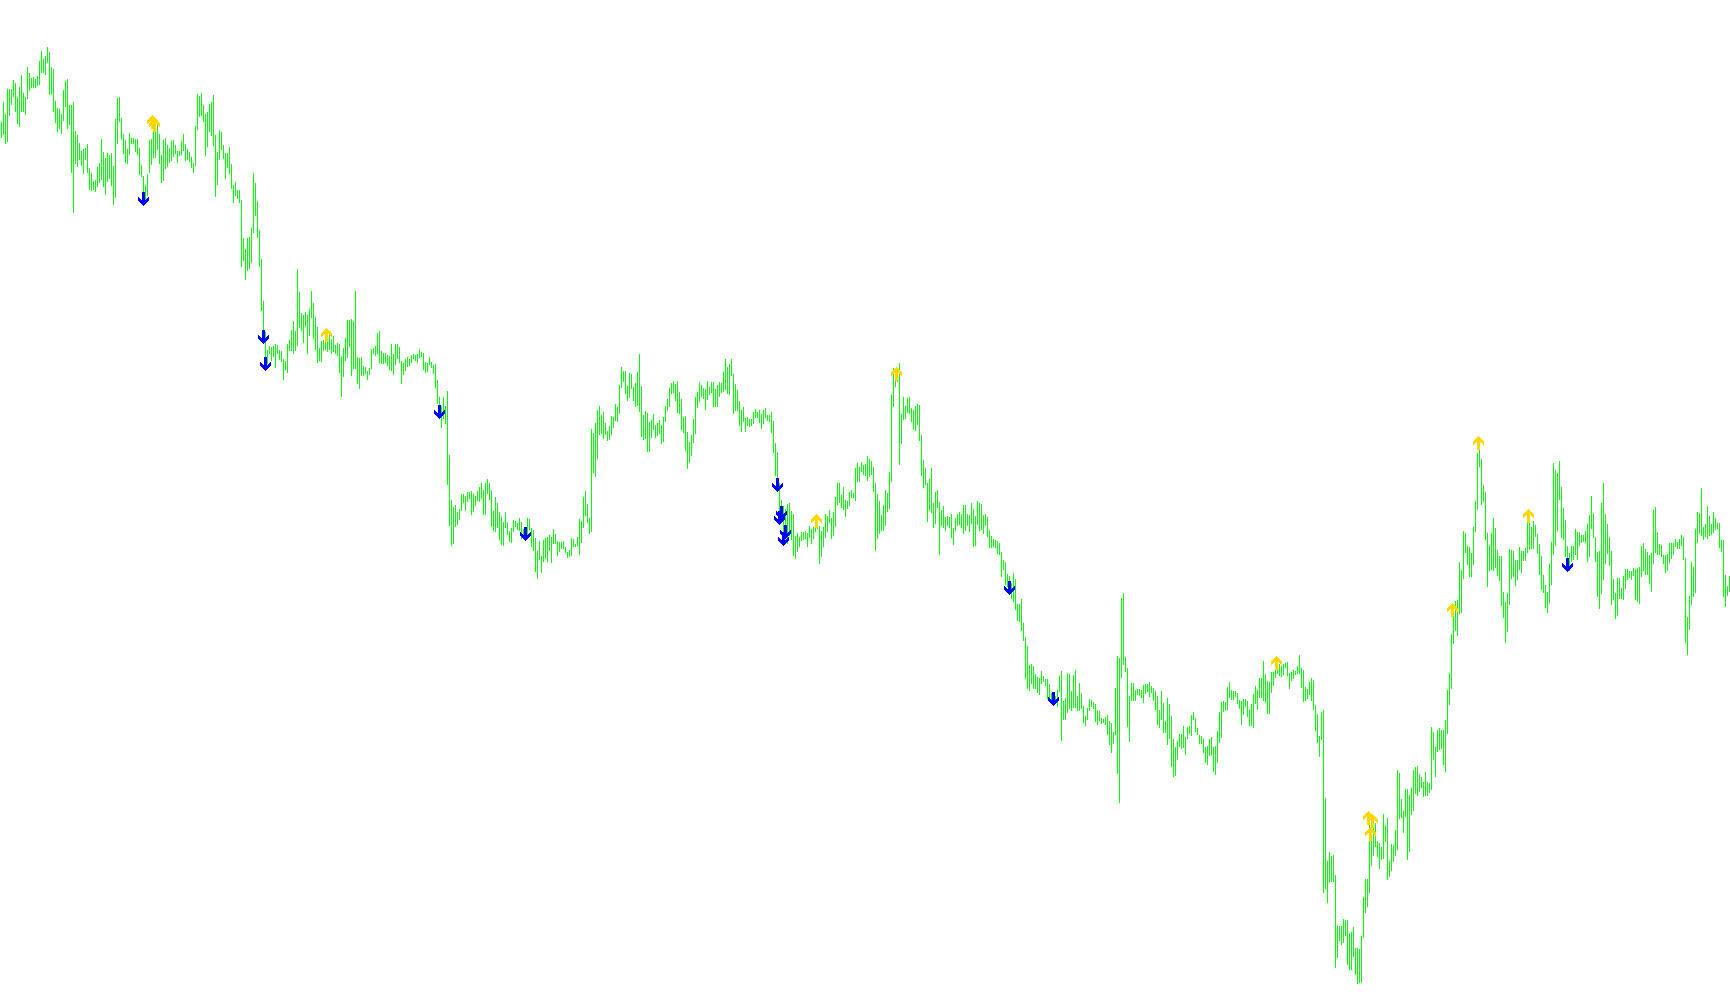
The 10 Minute Trader is a specialized technical analysis tool designed to identify potential momentum shifts in market price action by monitoring specific trends in the Relative Strength Index (RSI). Instead of looking at simple price movements, this indicator analyzes the underlying "strength" of the market to highlight areas where momentum may be reaching a tipping point.
How the Logic Works
The script functions by analyzing a sequence of data points over a rolling period. It specifically looks for consistent, linear progression in momentum rather than sudden spikes. Here is the breakdown of its operational logic:
- Momentum Tracking: The tool monitors the RSI (a common technical indicator used to measure speed and change of price movements) over a set interval. It evaluates the most recent data points against their immediate predecessors.
- Bullish Trend Identification (Up Arrows): The script looks for a "steady climb" in momentum. Specifically, it checks if the momentum value has increased consistently for five consecutive steps. If the market demonstrates this continuous upward growth in strength, the tool places an up arrow on the chart to signal a potential bullish trend.
- Bearish Trend Identification (Down Arrows): Conversely, the script monitors for a "steady decline." It checks if the momentum value has decreased consistently for five consecutive steps. When the data shows this continuous downward slide in strength, the tool places a down arrow on the chart to signal a potential bearish trend.
Visual Representation
The indicator simplifies complex data into clear visual cues directly on your trading screen:
- Upward Signals: These appear at the high point of a candle when the momentum is consistently strengthening.
- Downward Signals: These appear at the low point of a candle when the momentum is consistently weakening.
Key Takeaway for Traders
By filtering for consecutive momentum changes, this tool aims to help traders identify "trending" strength. Rather than reacting to every minor fluctuation, it seeks to highlight moments where the market is moving with purpose, providing a clearer visual guide for identifying potential entry or exit points based on momentum flow.
/*-----------------------------+
|			       |
| Shared by www.Aptrafx.com    |
|			       |
+------------------------------*/

//+------------------------------------------------------------------+
//| 10 Minute trader                                                 |
//+------------------------------------------------------------------+
#property copyright "Ron T"
#property link      "http://www.lightpatch.com"

#property indicator_chart_window
#property indicator_buffers 5
#property indicator_color1 White
#property indicator_color2 Red
#property indicator_color3 Aqua
#property indicator_color4 Blue
#property indicator_color5 LimeGreen

//---- buffers
double ExtMapBuffer1[];
double ExtMapBuffer2[];
double ExtMapBuffer3[];
double ExtMapBuffer4[];
double ExtMapBuffer5[];


// User Input


//+------------------------------------------------------------------+
//| Custom indicator initialization function                         |
//|------------------------------------------------------------------|

int init()
  {

   // 233 up arrow
   // 234 down arrow
   // 159 big dot
   // 168 open square

   SetIndexStyle(0,DRAW_ARROW);
   SetIndexBuffer(0, ExtMapBuffer1);
   SetIndexArrow(0,233);  //up

   SetIndexStyle(1,DRAW_ARROW);
   SetIndexBuffer(1, ExtMapBuffer2);
   SetIndexArrow(1,234);  //down

   SetIndexStyle(2,DRAW_ARROW);
   SetIndexBuffer(2, ExtMapBuffer3);
   SetIndexArrow(2,168);

   SetIndexStyle(3,DRAW_ARROW);
   SetIndexBuffer(3, ExtMapBuffer4);
   SetIndexArrow(3,168);

   SetIndexStyle(4,DRAW_ARROW);
   SetIndexBuffer(4, ExtMapBuffer5);
   SetIndexArrow(4,168);  //open square

   return(0);
  }


//+------------------------------------------------------------------+
//| Custor indicator deinitialization function                       |
//+------------------------------------------------------------------+
int deinit()
  {
   int i;

   for( i=0; i<Bars; i++ ) ExtMapBuffer1[i]=0;
   for( i=0; i<Bars; i++ ) ExtMapBuffer2[i]=0;
   for( i=0; i<Bars; i++ ) ExtMapBuffer3[i]=0;
   for( i=0; i<Bars; i++ ) ExtMapBuffer4[i]=0;
   for( i=0; i<Bars; i++ ) ExtMapBuffer5[i]=0;

   return(0);
  }


//+------------------------------------------------------------------+
//| Custom indicator iteration function                              |
//+------------------------------------------------------------------+
int start()
  {
   double   rsi0=0;
   double   rsi1=0;
   double   rsi2=0;
   double   rsi3=0;
   double   rsi4=0;
   double   rsi5=0;
   double   rsi6=0;
   double   rsi7=0;

   int pos=Bars-100;             // leave room for moving average periods

   while(pos>=0)
     {
      rsi0=iRSI(Symbol(),0,28,PRICE_CLOSE,pos+0);
      rsi1=iRSI(Symbol(),0,28,PRICE_CLOSE,pos+1);
      rsi2=iRSI(Symbol(),0,28,PRICE_CLOSE,pos+2);
      rsi3=iRSI(Symbol(),0,28,PRICE_CLOSE,pos+3);
      rsi4=iRSI(Symbol(),0,28,PRICE_CLOSE,pos+4);
      rsi5=iRSI(Symbol(),0,28,PRICE_CLOSE,pos+5);
      rsi6=iRSI(Symbol(),0,28,PRICE_CLOSE,pos+6);
      rsi7=iRSI(Symbol(),0,28,PRICE_CLOSE,pos+7);


      if (rsi0>rsi1 && rsi1>rsi2 && rsi2>rsi3 && rsi3>rsi4 && rsi4>rsi5)
        {
         ExtMapBuffer1[pos]=High[pos];
        }

      if (rsi0<rsi1 && rsi1<rsi2 && rsi2<rsi3 && rsi3<rsi4 && rsi4<rsi5)
        {
         ExtMapBuffer2[pos]=Low[pos];
        }

 	   pos--;
     }

   return(0);
  }
//+------------------------------------------------------------------+
Comments