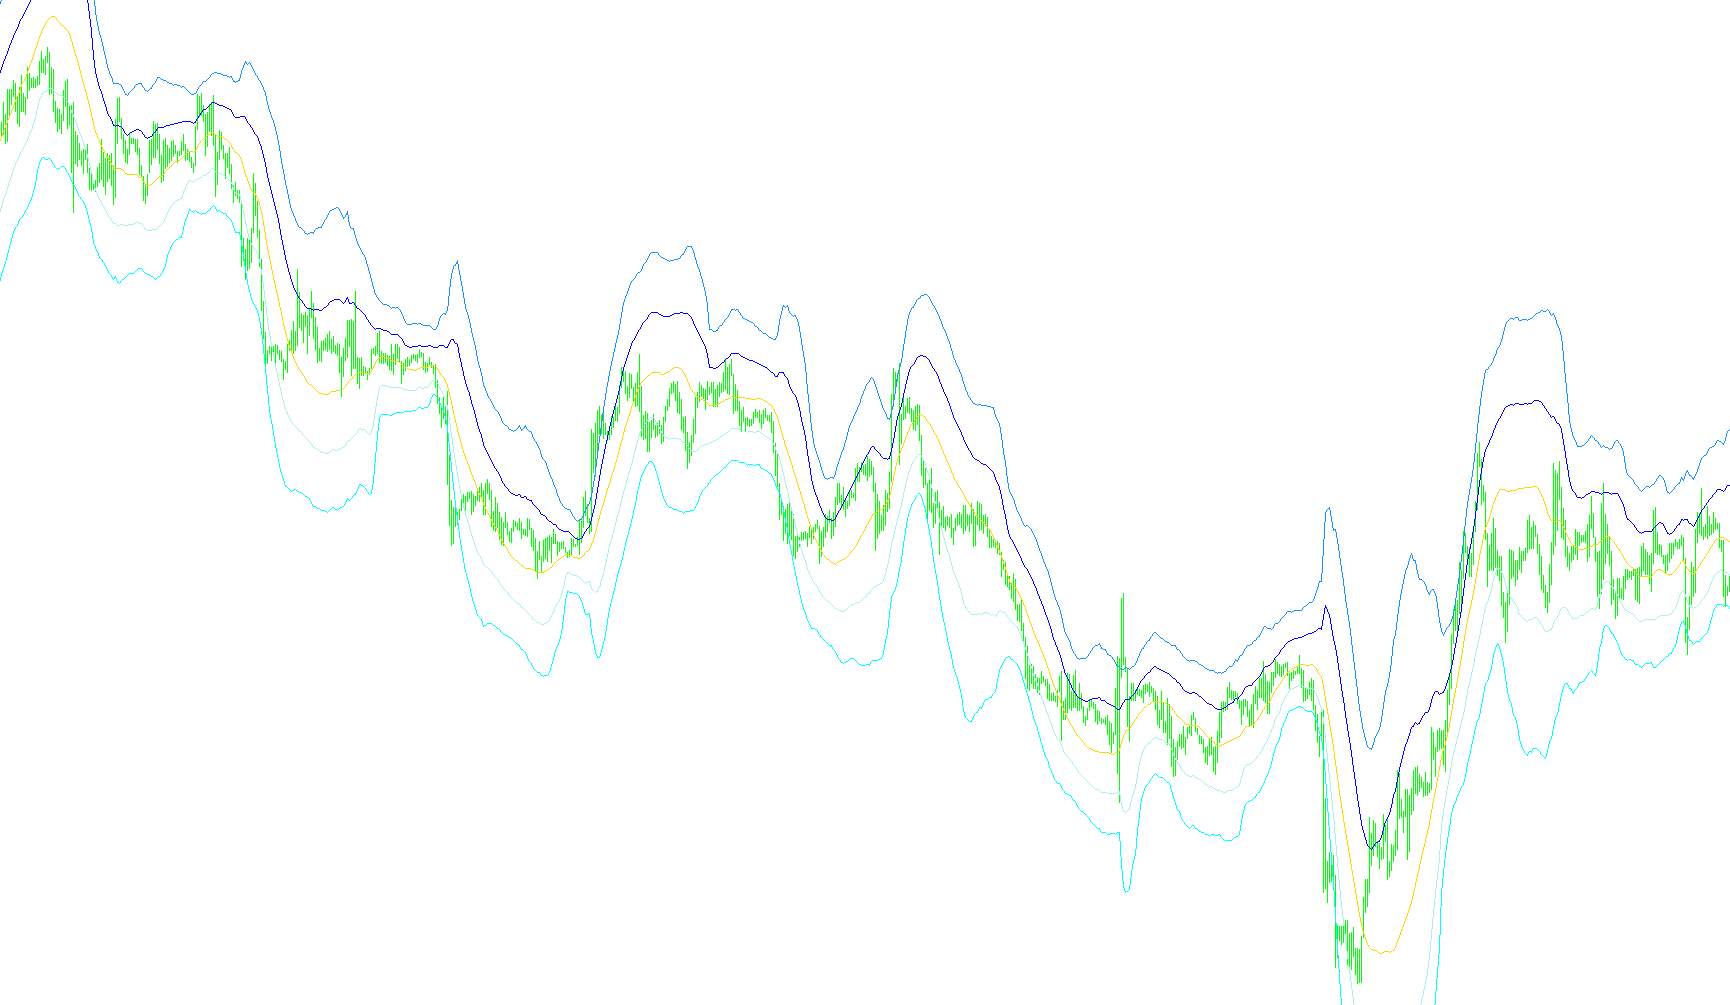
This technical tool is designed to analyze market trends by creating a dynamic "channel" on a price chart. Rather than simply following the current price, it uses sophisticated mathematical modeling to project a leading trendline and define volatility boundaries around it.
Core Logic & Methodology
1. Geometric Price Averaging Unlike standard indicators that might only look at the closing price, this script utilizes a unique "Geometric Mean" calculation. It takes into account the High, Low, and Close prices of each candle to determine a representative value. This provides a more holistic view of the price action within each specific period.
2. Linear Regression Modeling (Least Squares Fit) The heart of the script is based on a "Least Squares" fitting method. It looks at a specific number of past data points (the "Samples") to calculate a linear trend. By analyzing these historical points, it determines the most accurate path for a trendline. It essentially asks: "Based on how the price has moved over the last X periods, what is the straightest path of least resistance?"
3. Predictive Trend Projection The script uses the calculated coefficients from the regression model to project a "Leading Edge." This allows it to visualize where the trend is heading, providing a visual representation of the market's momentum rather than just reflecting where the price has already been.
4. Dynamic Volatility Bands (Standard Deviation) To help traders identify overextended prices or potential reversals, the script generates multiple bands above and below the main trendline.
- These bands are not fixed; they expand or contract based on the actual volatility of the data.
- The script calculates the "error" or distance between the actual price points and the predicted trendline to determine the spread.
- It provides two tiers of these bands (Standard Level 1 and Standard Level 2), allowing users to see a primary corridor of movement and a wider, secondary boundary for extreme market conditions.
Visual Summary
- The Center Line: Represents the projected "Leading Edge" or the primary direction of the trend based on historical data fitting.
- The Inner Bands: Represent standard volatility levels, showing the expected range of normal price fluctuations.
- The Outer Bands: Provide a secondary buffer to identify significant deviations from the trend, often used to spot areas where the market might be overbought or oversold.
//+------------------------------------------------------------------+
//|                                                                  |
//|                                   Copyleft © 2007, GammaRatForex |
//|                                    http://www.gammarat.com/Forex |
//+------------------------------------------------------------------+
#property copyright "Copyleft © 2007, GammaRatForex"
#property link      "http://www.gammarat.com/Forex/"
//design based on the principles similar to the MetaTrader STD Channel
// LSQ line fitting to the a number of samples.
// The trendline is the leading point in the fit;
// the bands are calculated somewhat differently, check the math below and adapt to
// your own needs as appropriate
// also the point estimate is given by the geometric mean
// MathPow(HCCC,.025) (see function "get_avg" below) rather than
// more standard estimates.
// It's computationally fairly intensive
//
//#property indicator_separate_window
//#property indicator_minimum 0
//#property indicator_maximum 100
#property indicator_chart_window
#property indicator_buffers 5
//----
#property indicator_color1 Aqua
#property indicator_color2 Aqua
#property indicator_color3 Aqua
#property indicator_color4 Red
#property indicator_color5 Red
#property indicator_style1 0
#property indicator_style2 2
#property indicator_style3 2
#property indicator_style4 2
#property indicator_style5 2
//---- input parameters
extern int  Samples=60;
extern int  LookAhead=0;
extern double StdLevel1=2;
extern double  StdLevel2 =4.;
//---- buffers
double LeadingEdgeBuffer[];
double LeadingEdgeBufferPlus1[];
double LeadingEdgeBufferNeg1[];
double LeadingEdgeBufferPlus2[];
double LeadingEdgeBufferNeg2[];
//+------------------------------------------------------------------+
//| Custom indicator initialization function                         |
//+------------------------------------------------------------------+
int init()
  {
//---- indicators
   if(LookAhead <0)LookAhead=0;
   SetIndexStyle(0,DRAW_LINE);
   SetIndexBuffer(0,LeadingEdgeBuffer);
   SetIndexShift(0,LookAhead);
   SetIndexDrawBegin(0,LookAhead+Samples+1);
   SetIndexLabel(0,"LeadingEdge Trend");
     if(MathAbs(StdLevel1) > 0)
     {
      SetIndexStyle(1,DRAW_LINE);
      SetIndexBuffer(1,LeadingEdgeBufferPlus1);
      SetIndexShift(1,LookAhead);
      SetIndexDrawBegin(1,LookAhead+Samples+1);
      SetIndexLabel(1,"LeadingEdge +" + DoubleToStr(StdLevel1,1)  + " STD");
      SetIndexStyle(2,DRAW_LINE);
      SetIndexBuffer(2,LeadingEdgeBufferNeg1);
      SetIndexShift(2,LookAhead);
      SetIndexDrawBegin(2,LookAhead+Samples+1);
      SetIndexLabel(2,"LeadingEdge -" + DoubleToStr(StdLevel1,1) + " STD");
     }
     if(MathAbs(StdLevel2) > 0)
     {
      SetIndexStyle(3,DRAW_LINE);
      SetIndexBuffer(3,LeadingEdgeBufferPlus2);
      SetIndexShift(3,LookAhead);
      SetIndexDrawBegin(3,LookAhead+Samples+1);
      SetIndexLabel(3,"LeadingEdge +" + DoubleToStr(StdLevel2,1) + " STD");
      SetIndexStyle(4,DRAW_LINE);
      SetIndexBuffer(4,LeadingEdgeBufferNeg2);
      SetIndexShift(4,LookAhead);
      SetIndexDrawBegin(4,LookAhead+Samples+1);
      SetIndexLabel(4,"LeadingEdge -" + DoubleToStr(StdLevel2,1) + " STD");
     }
   //compute();
//----
   return(0);
  }
//+------------------------------------------------------------------+
//|                                                                  |
//+------------------------------------------------------------------+
int start()
  {
   compute();
   return(0);
  }
//+------------------------------------------------------------------+
//|                                                                  |
//+------------------------------------------------------------------+
  int compute()
  {
   int    i,j,counted_bars=IndicatorCounted();
   static double a[2][2],b[2][2];
   double base_det,c0,c1,v1,v2,alpha,beta;
   static int a_loaded=0;
   double s0,s1;
   double c01,c11;
//----
   if(Bars<Samples) return(0);
   if(counted_bars==Bars) return(0);
     if(a_loaded==0)
     {
        for(i=0;i<2;i++)
        {
           for(j=0;j<2;j++)
           {
            a[i][j]=0;
           }
        }
        for(i=0;i<Samples;i++)
        {
         a[0][0]+=i*i;
         a[0][1]+=i;
         a[1][0]+=i;
         a[1][1]+=1;
        }
      a_loaded=1;
     }
   base_det=det2(a);
//----
     for(i=Bars-counted_bars; i>=0;i--)
     {
        if(i >=Bars-Samples)
        {
         continue;
        }
      c0=0;
      c1=0;
        for(j=0;j<Samples;j++)
        {
         c0=c0+j*get_avg(i+j);
         c1=c1+get_avg(i+j);
        }
      ArrayCopy(b,a);
      b[0][0]=c0;
      b[1][0]=c1;
      alpha=det2(b)/base_det;
      ArrayCopy(b,a);
      b[0][1]=c0;
      b[1][1]=c1;
      beta=det2(b)/base_det;
//----
      LeadingEdgeBuffer[i]=(alpha*(-LookAhead)+beta)*Point;
      c0=0;
      c1=0;
      c11 =0;
      c01=0;
        for(j=0;j<Samples;j++)
        {
         s0=get_avg(i+j);
         s1=j*alpha+beta;
           if(s0<s1)
           {
            c0+=MathPow(s0-s1,2);
            c01+=1;
            }
            else
            {
            c1+=MathPow(s0-s1,2);
            c11+=1;
           }
        }
      if(c01==0) c01=1;
      if(c11== 0) c11=1;
//----
      c01=MathSqrt(1./(0.5/MathPow(Samples,2) +0.5/c01/c01));
      c11=MathSqrt(1./(0.5/MathPow(Samples,2) +0.5/c11/c11));
      //c0 = MathSqrt(c0/(Samples-1));
      c0=MathSqrt(c0/c01);//MathSqrt(c01*Samples));
      //c1 = MathSqrt(c1/(Samples-1));
      c1=MathSqrt(c1/c11);//MathSqrt(c11*Samples));
        if(MathAbs(StdLevel1)>0)
        {
         LeadingEdgeBufferPlus1[i]=LeadingEdgeBuffer[i]+StdLevel1*c0*Point;
         LeadingEdgeBufferNeg1[i]=LeadingEdgeBuffer[i]-StdLevel1*c1*Point;
        }
        if(MathAbs(StdLevel2)>0)
        {
         LeadingEdgeBufferPlus2[i]=LeadingEdgeBuffer[i]+StdLevel2*c0*Point;
         LeadingEdgeBufferNeg2[i]=LeadingEdgeBuffer[i]-StdLevel2*c1*Point;
        }
     }
  }
//+------------------------------------------------------------------+
//|                                                                  |
//+------------------------------------------------------------------+
  double get_avg(int k)
  {
   return(MathPow((High[k]*Low[k]*Close[k]*Close[k]),1/4.)/Point);
  }
//+------------------------------------------------------------------+
//|                                                                  |
//+------------------------------------------------------------------+
  double det2(double a[][])
  {
   return(a[0][0]*a[1][1]-a[1][0]*a[0][1]);
  }
//+------------------------------------------------------------------+
Comments