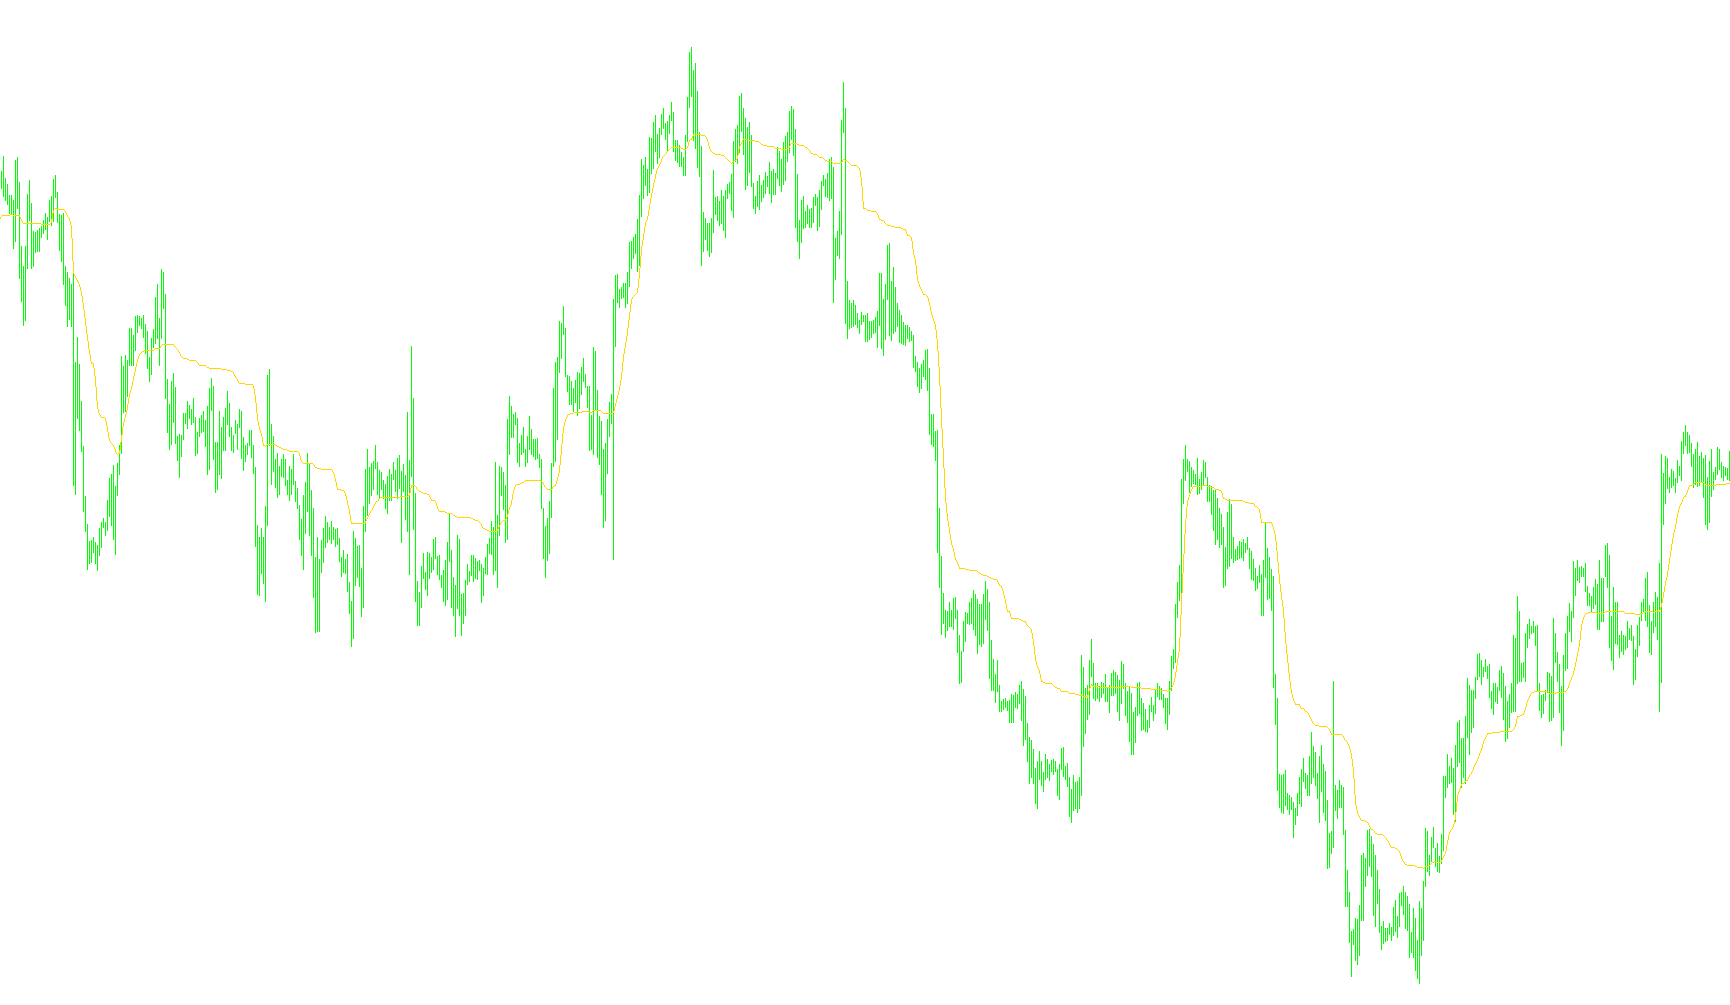
This tool is designed to provide a dynamic, self-adjusting visual guide for identifying market trends. Unlike standard moving averages that react at a fixed speed to price changes, this script utilizes an "Adaptive" logic, meaning it modifies its sensitivity based on the current volatility and momentum of the market.
How the Logic Works
The indicator functions by constantly analyzing the relationship between price movement and historical trends. It processes data through three primary stages:
1. Volatility Measurement The script looks at a specific window of recent price bars to calculate the total "path" traveled by the price. By measuring the absolute distance of each price tick within this window, it establishes a baseline of how much the market is currently moving—whether it is in a high-activity state or a quiet, sideways phase.
2. Trend Efficiency Analysis Next, the logic compares the current price change against that established volatility. It calculates an efficiency ratio:
- If the price is moving strongly in one direction with very little "noise," the indicator recognizes a high-momentum trend.
- If the price is fluctuating wildly without making significant progress, the indicator identifies this as low-efficiency movement.
3. Dynamic Adaptation This is where the "adaptive" nature comes into play. The script uses the efficiency ratio to decide how much weight to give to the most recent price data.
- In a strong, clear trend, the logic adjusts to become more responsive, allowing the indicator line to follow the price more closely.
- In a choppy or sideways market, the logic automatically dampens its reaction, smoothing out the line to prevent "false signals" caused by minor price flickers.
The Result
The final output is a single red line on your chart that attempts to balance two competing needs: it wants to be fast enough to capture new trends as they happen, but smooth enough to ignore insignificant market noise. By automatically recalculating its own sensitivity at every new bar, it aims to provide a more "intelligent" perspective on the market's direction than a traditional static average.
//+------------------------------------------------------------------+
//|                                          Adaptive Moving Average |
//|                                                    Denis Janulis |
//+------------------------------------------------------------------+
#property copyright "Denis Janulis"
#property link      "denis.j@mits.lv"

#property indicator_chart_window
#property indicator_buffers 1
#property indicator_color1 Red
//---- indicator parameters
extern int n = 10;
extern int p =  2;
extern int q = 30;

//---- indicator buffers
double AMA[];
//----
int ExtCountedBars=0;
//+------------------------------------------------------------------+
//| Custom indicator initialization function                         |
//+------------------------------------------------------------------+
int init()
  {
   int    draw_begin;
   string short_name;
//---- drawing settings
   SetIndexStyle(0,DRAW_LINE);
   IndicatorDigits(MarketInfo(Symbol(),MODE_DIGITS));
   SetIndexDrawBegin(0,draw_begin);
//---- indicator buffers mapping
   SetIndexBuffer(0,AMA);
//---- initialization done
   return(0);
  }
//+------------------------------------------------------------------+
//|                                                                  |
//+------------------------------------------------------------------+
int start()
  {
  double FC;
  double SC;
  double ER;
  double SSC;
  double c;

int i = Bars-1;

   AMA[i+1] = Close[i];
   while(i>=0)
     {
//-----
  FC =  (p+1);
  SC =  (q+1);
  FC = 2/FC;
  SC = 2/SC;
      double V = 0;
      double D = Close[i]-Close[i+n];
      for (int s = i; s <= i+n; s++) V = V + MathAbs(Close[s]-Close[s+1]);
      ER = D/V;
      SSC = ER*(FC-SC)+SC;
      c = SSC*SSC;
//-----
      AMA[i] = AMA[i+1]+c*(Close[i]-AMA[i+1]);
 	   i--;
     }


//~~~~~~~~~~~~~~~~~~~~~~~~~~~~~~~~~~~~~~~~~~~~~~~~~~~~~~~~~~~~~~~~~~~~~
   return(0);
  }
Comments