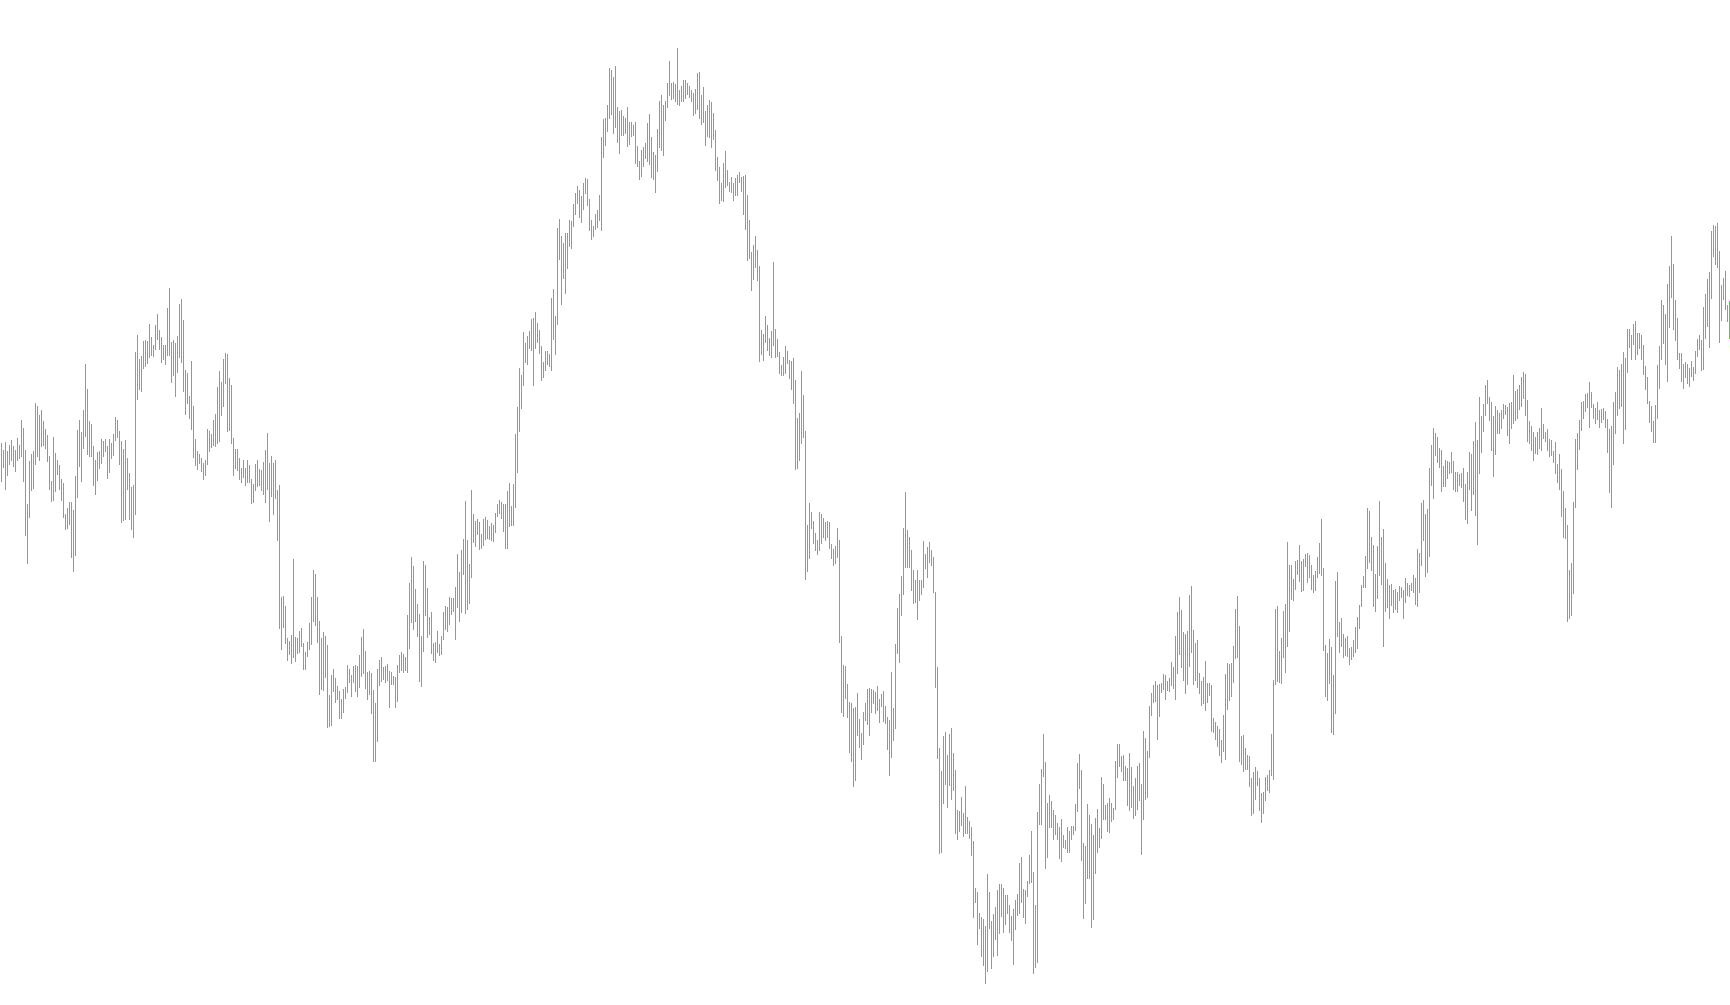
This tool is designed to enhance your trading experience by providing a visual representation of higher timeframes directly on your current chart. Often, traders find it difficult to jump back and forth between different timeframes (for example, looking at 4-hour candles while trading on a 15-minute chart). This script solves that problem by projecting the structural data of a larger timeframe onto your active workspace.
How it Works
The logic behind this indicator focuses on "Multi-Timeframe" (MTF) visualization. It automatically identifies the price action from a higher timeframe—which you can customize in the settings—and draws representative shapes on your screen to show where those larger candles sit in relation to your current view.
Key Features and Logic:
- Higher Timeframe Projection: The script looks at a specific timeframe (such as 240 minutes) and extracts the essential data points from its most recent candles, including the high, low, open, and close prices.
- Visual Representation: Instead of just showing you raw numbers, it creates distinct visual markers:
- Body Blocks: It renders rectangles that represent the "body" of the higher timeframe candles.
- Wicks/Shadows: It draws horizontal lines to signify the upper and lower reaches (the wicks) of those larger candles.
- Dynamic Coloring: The tool intelligently detects the direction of the higher timeframe movement. If the large candle closed higher than it opened, it applies an "Up" color (Blue); if it closed lower, it applies a "Down" color (Red). This allows you to see at a glance whether the larger trend is bullish or bearish without switching screens.
- Automatic Updating: The script constantly calculates the time difference between price bars to ensure that the projected shapes are aligned correctly with your current chart's timeline.
Summary for the User
Essentially, this tool acts as a "bridge." It allows you to maintain your focus on a smaller, more detailed timeframe while keeping the "big picture" visible at all times. By visualizing the high, low, and body of larger candles directly over your current price action, it helps you stay aligned with the broader market structure.
/*-----------------------------+
|			       |
| Shared by www.Aptrafx.com    |
|			       |
+------------------------------*/

//+------------------------------------------------------------------+
//|                                                 #MTF Candles.mq4 |
//|                                      Copyright © 2006, Eli Hayun |
//|                                          http://www.elihayun.com |
//+------------------------------------------------------------------+
#property copyright "Copyright © 2006, Eli Hayun"
#property link      "http://www.elihayun.com"

#property indicator_chart_window
//---- input parameters
extern int       CandlesTF=240;
extern color     UpCandleColor = Blue;
extern color     DownCandleColor = Red;
//+------------------------------------------------------------------+
//| Custom indicator initialization function                         |
//+------------------------------------------------------------------+
int init()
  {
//---- indicators
//----
   return(0);
  }
//+------------------------------------------------------------------+
//| Custom indicator deinitialization function                       |
//+------------------------------------------------------------------+
int deinit()
  {
//----

//----
   return(0);
  }
//+------------------------------------------------------------------+
//| Custom indicator iteration function                              |
//+------------------------------------------------------------------+
int start()
  {
   int    counted_bars=IndicatorCounted();
//----
   double dif = MathAbs(Time[1] - Time[2]);

   int ix = 0;
   datetime dtStart = dif * 8 + Time[0];
   for (int ii=0; ii<8; ii+=2)
   {
      ObjectDelete("rect"+ii); ObjectDelete("OTrnd"+ii); ObjectDelete("CTrnd"+ii);
      ObjectCreate("rect"+ii,OBJ_TREND, 0, dtStart, iLow(NULL, CandlesTF,ix), dtStart, iHigh(NULL,CandlesTF,ix));
      color clr = DownCandleColor; if (iOpen(NULL, CandlesTF,ix) < iClose(NULL, CandlesTF,ix)) clr = UpCandleColor;
      ObjectSet("rect"+ii, OBJPROP_COLOR, clr);
      ObjectSet("rect"+ii, OBJPROP_RAY, False);

      ObjectCreate("OTrnd"+ii, OBJ_TREND, 0, dtStart, iOpen(NULL, CandlesTF,ix), dtStart-dif, iOpen(NULL,CandlesTF,ix));
      ObjectSet("OTrnd"+ii, OBJPROP_RAY, False);
      ObjectCreate("CTrnd"+ii, OBJ_TREND, 0, dtStart, iClose(NULL, CandlesTF,ix), dtStart+dif, iClose(NULL,CandlesTF,ix));
      ObjectSet("CTrnd"+ii, OBJPROP_RAY, False);

      dtStart -= dif * 2;
      ix++;
    }

//----
   return(0);
  }
//+------------------------------------------------------------------+
Comments