_MTF_Candles
Download script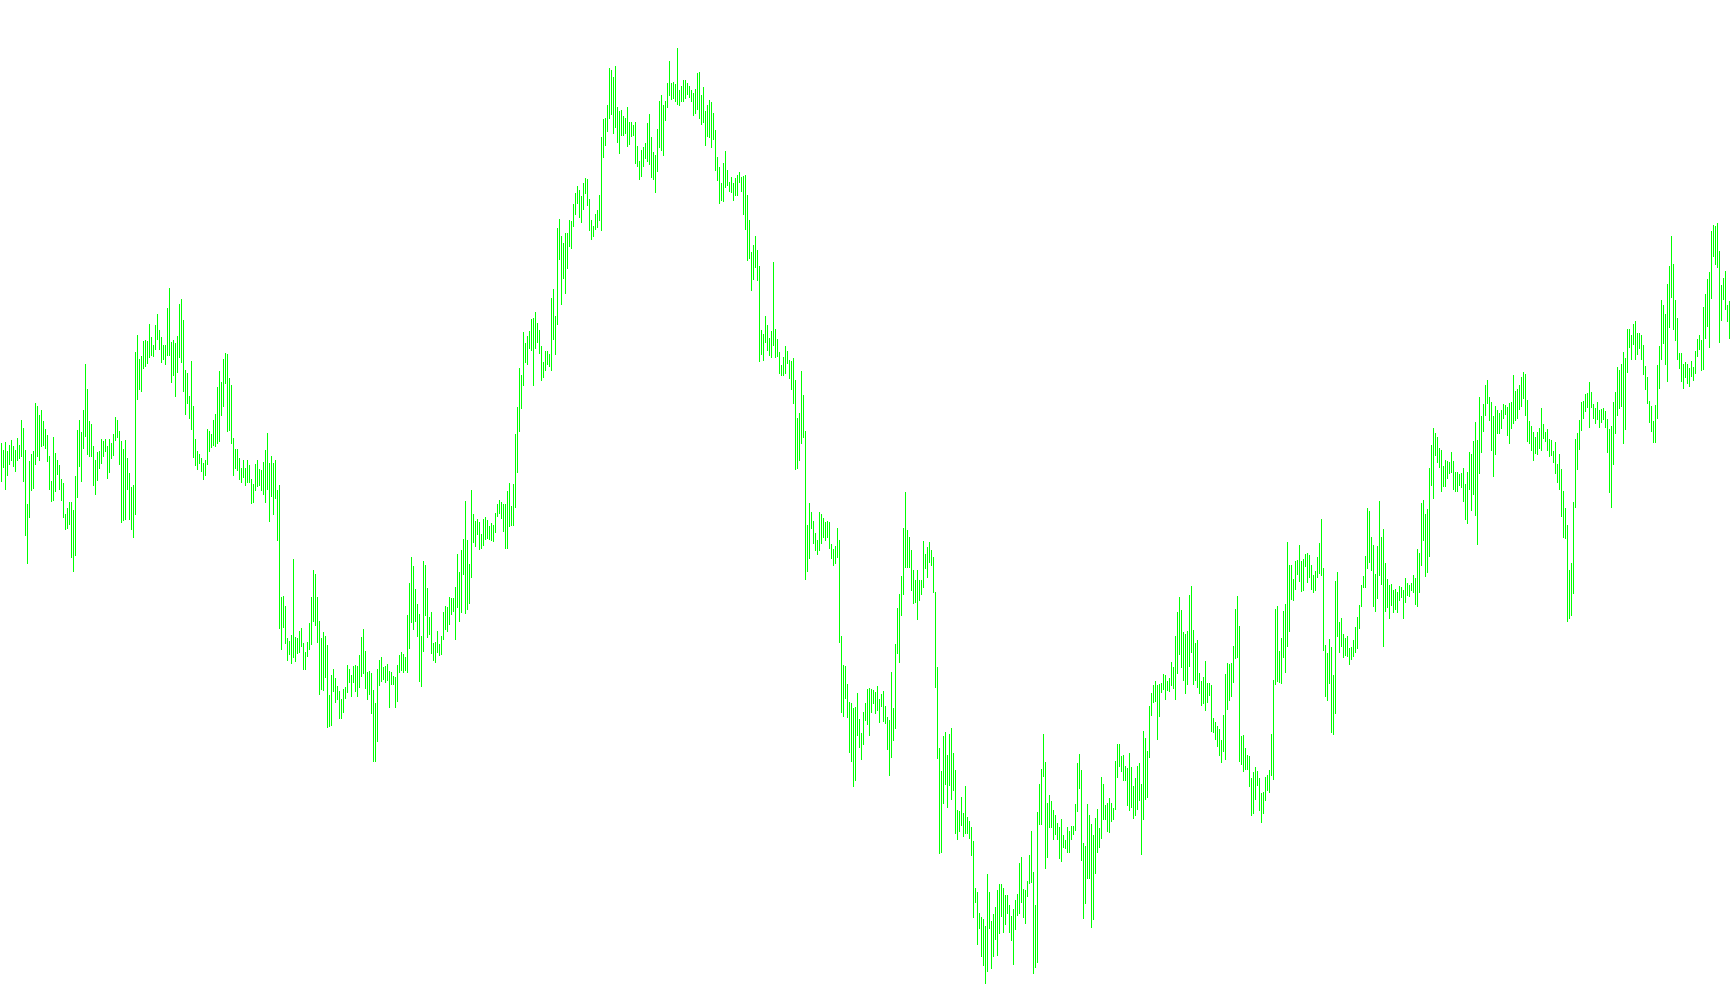
This tool is designed to provide traders with a multi-timeframe visual perspective, allowing them to see the price action of larger timeframes directly on their current smaller timeframe chart. Instead of forcing a trader to switch back and forth between different windows (for example, moving from a 15-minute chart to a 4-hour chart), this script overlays the structural information of the higher timeframe onto the primary view.
How the Logic Works:
Timeframe Synchronization The tool allows you to select a specific "higher" timeframe (such as 240 minutes). It then analyzes the historical price data for that specific period—looking at where the candles opened, closed, and reached their highest and lowest points—and translates that information into your current view.
Visual Representation of Price Action Rather than just showing a single line, the script reconstructs the "body" and "range" of those higher timeframe candles using geometric shapes:
- Candle Bodies: The script identifies whether a candle on the higher timeframe was bullish (up) or bearish (down). It then draws a colored block representing that movement. These are colored specifically to distinguish between price increases (Light Blue) and decreases (Red).
- High/Low Ranges: It maps out the vertical boundaries of the higher timeframe candles, showing the total price range covered during that period.
- Open/Close Markers: The logic places specific horizontal markers to show exactly where the higher timeframe candle started and ended relative to the current price action.
Dynamic Alignment The script automatically calculates the mathematical difference in time between candles. It then "stacks" these higher timeframe shapes onto your chart sequentially. This creates a visual timeline where you can see exactly how much space a 4-hour or daily candle occupies on your smaller, more detailed chart.
Key Benefits for the User:
- Contextual Awareness: You can instantly see the "big picture" market structure without losing sight of the small-scale price movements.
- Simplified Analysis: It eliminates the need to manually calculate where a large candle sits on a smaller timeframe, as the script handles all the spatial positioning automatically.
- Visual Clarity: By using distinct colors for up and down movements, it provides an immediate sense of market sentiment from the higher timeframe.
/*-----------------------------+
|			       |
| Shared by www.Aptrafx.com    |
|			       |
+------------------------------*/

//+------------------------------------------------------------------+
//|                                                 #MTF Candles.mq4 |
//|                                      Copyright © 2006, Eli Hayun |
//|                                          http://www.elihayun.com |
//+------------------------------------------------------------------+
#property copyright "Copyright © 2006, Eli Hayun"
#property link      "http://www.elihayun.com"

#property indicator_chart_window
//---- input parameters
extern int       CandlesTF=240;
extern color     UpCandleColor = LightBlue;
extern color     DownCandleColor = Red;
//+------------------------------------------------------------------+
//| Custom indicator initialization function                         |
//+------------------------------------------------------------------+
int init()
  {
//---- indicators
//----
   return(0);
  }
//+------------------------------------------------------------------+
//| Custom indicator deinitialization function                       |
//+------------------------------------------------------------------+
int deinit()
  {
//----

//----
   return(0);
  }
//+------------------------------------------------------------------+
//| Custom indicator iteration function                              |
//+------------------------------------------------------------------+
int start()
  {
   int    counted_bars=IndicatorCounted();
//----
   double dif = MathAbs(Time[1] - Time[2]);

   int ix = 0;
   datetime dtStart = dif * 8 + Time[0];
   for (int ii=0; ii<8; ii+=2)
   {
      ObjectDelete("rect"+ii); ObjectDelete("OTrnd"+ii); ObjectDelete("CTrnd"+ii);
      ObjectCreate("rect"+ii,OBJ_TREND, 0, dtStart, iLow(NULL, CandlesTF,ix), dtStart, iHigh(NULL,CandlesTF,ix));
      color clr = DownCandleColor; if (iOpen(NULL, CandlesTF,ix) < iClose(NULL, CandlesTF,ix)) clr = UpCandleColor;
      ObjectSet("rect"+ii, OBJPROP_COLOR, clr);
       ObjectSet("rect"+ii, OBJPROP_WIDTH, 3);

      ObjectSet("rect"+ii, OBJPROP_RAY, False);


      ObjectCreate("OTrnd"+ii, OBJ_TREND, 0, dtStart, iOpen(NULL, CandlesTF,ix), dtStart-dif, iOpen(NULL,CandlesTF,ix));
       ObjectSet("OTrnd"+ii, OBJPROP_WIDTH, 2);
      ObjectSet("OTrnd"+ii, OBJPROP_RAY, False);

      ObjectSet("CTrnd"+ii, OBJPROP_WIDTH, 2);
      ObjectCreate("CTrnd"+ii, OBJ_TREND, 0, dtStart, iClose(NULL, CandlesTF,ix), dtStart+dif, iClose(NULL,CandlesTF,ix));
      ObjectSet("CTrnd"+ii, OBJPROP_WIDTH, 2);
      ObjectSet("CTrnd"+ii, OBJPROP_RAY, False);

      dtStart -= dif * 2;
      ix++;
    }

//----
   return(0);
  }
//+------------------------------------------------------------------+
Comments