LGP_Ivanoff_Maloma-Demark_Levels
Download script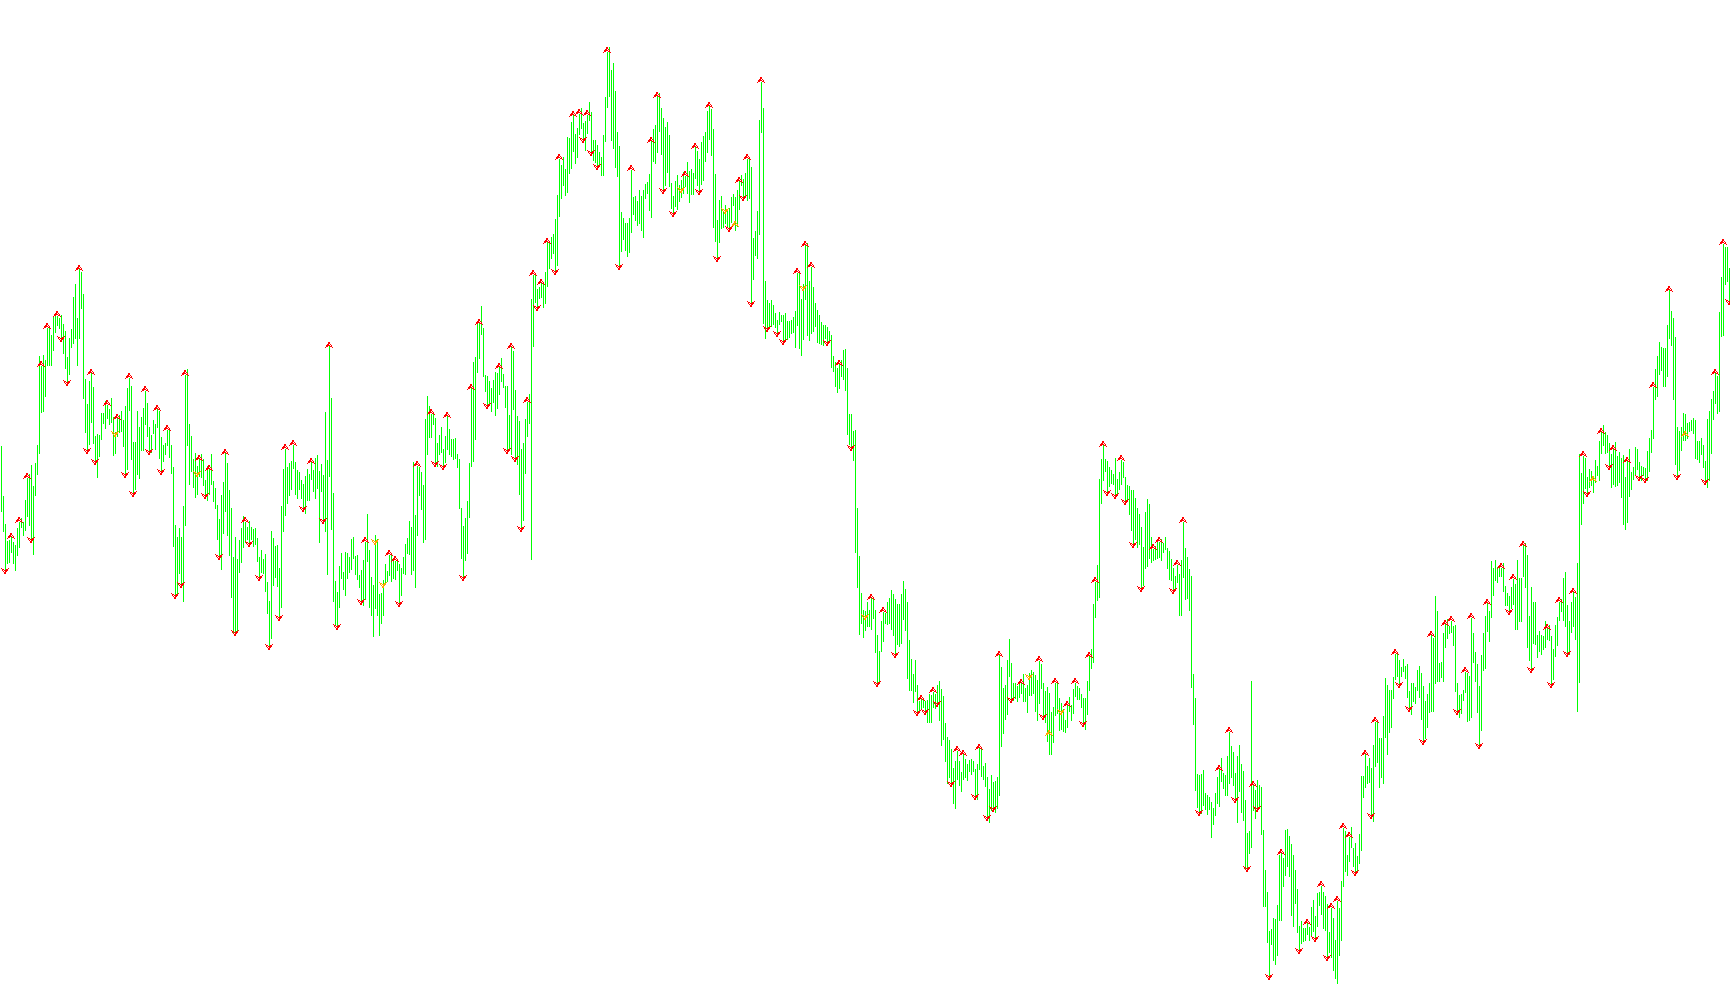
This script is a specialized technical analysis tool designed to identify and highlight significant price levels on a trading chart. Its primary purpose is to automatically detect "pivot points" or structural turning points in the market by analyzing historical price action.
Core Functionality
The logic operates by scanning back through a specific number of candles (user-defined, default is 1,000) to identify where the market has shifted direction. It looks for specific patterns that suggest a price has reached a peak or a trough, then marks these locations with visual icons on your chart.
How the Logic Works
1. Price Pattern Recognition The tool evaluates price movement based on two main categories: "Highs" and "Lows."
- Highs: The script searches for instances where the price has moved upward, reaching a point higher than the surrounding bars. It specifically looks for a sequence where the current price is greater than the previous candle and also higher than the candles following it.
- Lows: Conversely, it searches for downward movements where the price drops below the preceding candle and remains lower than the subsequent candles.
2. Dynamic Precision Adjustment One of the key features of this logic is its ability to adapt to different timeframes (e.g., Daily, 4-Hour, Hourly, or 15-Minute charts). It automatically calculates a small "buffer" or offset value based on the timeframe you are viewing. This ensures that the markings appear consistently and accurately regardless of whether you are looking at a high-level daily trend or a low-level minute-by-minute fluctuation.
3. Duplicate Handling The script includes an intelligent skipping mechanism. If the market stays flat (the price remains unchanged for several consecutive bars), the tool recognizes this as a single continuous period. It skips over these "flat" bars to ensure that it only marks significant changes in price rather than cluttering the chart with redundant icons during periods of consolidation.
4. Visual Marking Once a confirmed high or low is detected, the script places specific visual markers (arrows) on the chart:
- High Markers: These appear at structural peaks. Depending on whether the current close is higher or lower than the previous candle's high, it places the marker at the appropriate price boundary.
- Low Markers: These appear at structural troughs. Similar to the highs, they are placed precisely at the bottom boundaries of a downward move.
Summary for the User
Essentially, this script acts as a "map" for your chart. Instead of you having to manually guess where the market turned around, the tool scans the history, filters out "noise" and flat periods, and places visual highlights on the most significant price peaks and valleys. This allows traders to quickly see historical structural levels that may act as support or resistance in future price movements.
//+------------------------------------------------------------------+
//|                             LGP_Ivanoff_Maloma-Demark_levels.mq4 |
//|                      Copyright © 2006, LGP                       |
//|                                        http://www.metaquotes.net |
//+------------------------------------------------------------------+
#property copyright "Copyright © 2006, LGP"
#property link      "http://www.metaquotes.net"
//----
#property indicator_chart_window
#property indicator_buffers 4
#property indicator_color1 Red
#property indicator_color2 Orange
#property indicator_color3 Red
#property indicator_color4 Orange
//---- input parameters
extern   int      nBars=1000;
extern   color    color1=Red;
extern   color    color2=Orange;
extern   int      width_H_L=0;
//---- buffers
double ExtMapBuffer1[];
double ExtMapBuffer2[];
double ExtMapBuffer3[];
double ExtMapBuffer4[];
//----
int D1=1440, H4=240, H1=60, M15=15;
double P;
//+------------------------------------------------------------------+
//| Custom indicator initialization function                         |
//+------------------------------------------------------------------+
int init()
  {
   if (nBars>Bars)
      nBars=Bars;
//----
   if (Period()==D1)P=15*Point;
   if (Period()==H4)P=7*Point;
   if (Period()==H1)P=4*Point;
   if (Period()==30)P=3*Point;
   if (Period()==M15)P=2*Point;
   if (Period()==5)P=1*Point;
   if (Period()==1)P=0.5*Point;
//---- indicators
   SetIndexStyle(0,DRAW_ARROW,EMPTY,width_H_L,color1);
   SetIndexArrow(0,217);
   SetIndexBuffer(0,ExtMapBuffer1);
   SetIndexEmptyValue(0,0.0);
   //
   SetIndexStyle(1,DRAW_ARROW,EMPTY,width_H_L,color2);
   SetIndexArrow(1,217);
   SetIndexBuffer(1,ExtMapBuffer2);
   SetIndexEmptyValue(1,0.0);
   //
   SetIndexStyle(2,DRAW_ARROW,EMPTY,width_H_L,color1);
   SetIndexArrow(2,218);
   SetIndexBuffer(2,ExtMapBuffer3);
   SetIndexEmptyValue(2,0.0);
   //
   SetIndexStyle(3,DRAW_ARROW,EMPTY,width_H_L,color2);
   SetIndexArrow(3,218);
   SetIndexBuffer(3,ExtMapBuffer4);
   SetIndexEmptyValue(3,0.0);
//----
   return(0);
  }
//+------------------------------------------------------------------+
//| Custor indicator deinitialization function                       |
//+------------------------------------------------------------------+
int deinit()
  {
   return(0);
  }
//+------------------------------------------------------------------+
//|                                                                  |
//+------------------------------------------------------------------+
int start()
  {
   //High
   for(int i=1;i<=nBars-2;i++)
     {
      int j=i;
      for(int k=i;k<=nBars-2;k++)
        {
         if(Close[j+1]!=Close[i] )
            break;
         j++;
        }
      //
      if(Close[i]>Close[i-1] && Close[i]>Close[j+1] && Close[j+1]>Close[j+2] )
        {
         if(Close[i]>High[i-1] )
         { ExtMapBuffer2[i-1]=Close[i-1]+P; }
         else { ExtMapBuffer1[i]=High[i]+P; }
        }
      //
      i=j;
     }
   //Low
   for(i=1;i<=nBars-2;i++)
     {
      j=i;
      for(k=i;k<=nBars-2;k++)
        {
         if(Close[j+1]!=Close[i] )
            break;
         j++;
        }
      //
      if(Close[i]<Close[i-1] && Close[i]<Close[j+1] && Close[j+1]<Close[j+2] )
        {
         if(Close[i]<Low[i-1] )
         { ExtMapBuffer4[i-1]=Close[i-1]-P; }
         else { ExtMapBuffer3[i]=Low[i]-P; }
        }
      //
      i=j;
     }
   return(0);
  }
//+------------------------------------------------------------------+
Comments