3 MAs Cross Arrows_001
Download script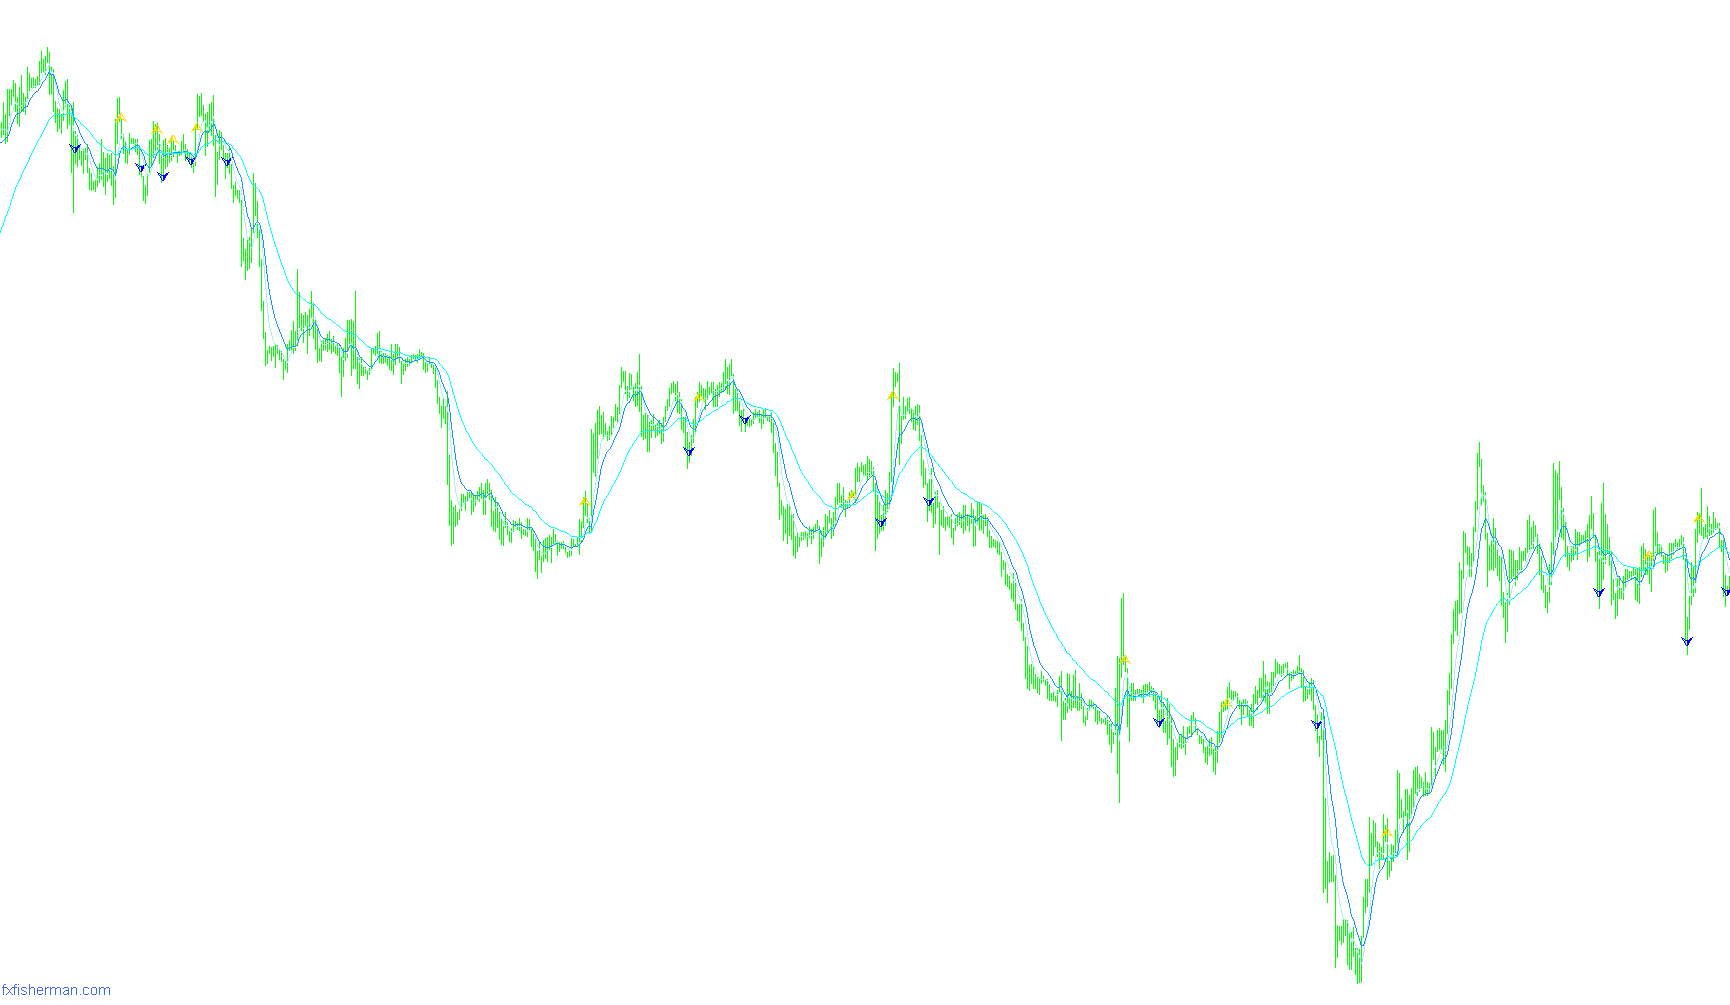
This script is designed as a visual technical analysis tool for trading platforms. It automates the tracking of three different Moving Averages (MAs) to identify potential momentum shifts in price action by plotting specific signals directly on your chart.
Core Logic and Functionality
The primary objective of this tool is to simplify market trend identification by filtering out "noise" and highlighting clear crossovers between short-term and long-term averages.
1. Moving Average Tracking The script calculates three distinct Moving Averages simultaneously:
- MA1: A fast-moving average (short period).
- MA2: A medium-moving average.
- MA3: A slow-moving average (long period).
By plotting all three of these on your chart, the tool provides a visual map of the market's current trajectory. When these lines align or cross one another, they indicate changes in the speed and direction of price movement.
2. Signal Detection (The "Crossover" Logic) The script looks for specific mathematical conditions to determine when a trend has shifted. Instead of just comparing two lines, it uses a confirmation logic involving the fast and medium averages relative to the slow average:
- Buy Signals: The tool identifies a bullish sentiment when both the fast (MA1) and medium (MA2) averages move above the slow (MA3) average. When this condition is met for the first time, the script places a specific arrow on the chart at the opening price of that candle.
- Sell Signals: Conversely, the tool identifies a bearish sentiment when both the fast (MA1) and medium (MA2) averages move below the slow (MA3) average. When this occurs, it places a corresponding arrow to indicate a potential downward move.
3. State Management To prevent the chart from being cluttered with repetitive arrows during a single sustained trend, the script includes a "memory" feature. It tracks the current signal state; once a Buy signal is triggered, it will not place another Buy arrow until a Sell condition has occurred, and vice versa. This ensures that you only see the initial entry point of a new trend.
Visual Elements
- Dynamic Plotting: The script draws three continuous lines representing your chosen Moving Averages.
- Visual Alerts: It uses distinct arrows (White for Buy signals, Red for Sell signals) to provide immediate, glanceable data on where the trend logic has triggered.
- Data Display: The script also provides a real-time text comment on the chart showing the numerical values of all three Moving Averages, allowing for precise data monitoring alongside the visual arrows.
//+------------------------------------------------------------------+
//|                3 MAs Cross Arrows.mq4                            |
//|                Copyright © 2006  Scorpion@fxfisherman.com        |
//+------------------------------------------------------------------+
#property copyright "FxFisherman.com"
#property link      "http://www.fxfisherman.com"

#property indicator_chart_window
#property indicator_buffers 5
#property indicator_color1 White
#property indicator_color2 White
#property indicator_color3 Blue
#property indicator_color4 Red
#property indicator_color5 Red

extern int MA1_Period = 5;
extern int MA1_Type = 1;
extern int MA2_Period = 10;
extern int MA2_Type = 1;
extern int MA3_Period = 34;
extern int MA3_Type = 1;
extern int Shift_Bars=0;
extern int Bars_Count= 10000;

//---- buffers
double v1[];
double v2[];
double v3[];
double v4[];
double v5[];

int init()
  {

   IndicatorBuffers(5);
   SetIndexArrow(0,217);
   SetIndexStyle(0,DRAW_ARROW,STYLE_SOLID,1);
   SetIndexDrawBegin(0,-1);
   SetIndexBuffer(0, v1);
   SetIndexLabel(0,"Buy");

   SetIndexArrow(1,218);
   SetIndexStyle(1,DRAW_ARROW,STYLE_SOLID,1);
   SetIndexDrawBegin(1,-1);
   SetIndexBuffer(1, v2);
   SetIndexLabel(1,"Sell");

   SetIndexStyle(2,DRAW_LINE,STYLE_SOLID,1);
   SetIndexDrawBegin(2,-1);
   SetIndexBuffer(2, v3);
   SetIndexLabel(2,"MA1");

   SetIndexStyle(3,DRAW_LINE,STYLE_SOLID,1);
   SetIndexDrawBegin(3,-1);
   SetIndexBuffer(3, v4);
   SetIndexLabel(3,"MA2");

   SetIndexStyle(4,DRAW_LINE,STYLE_SOLID,1);
   SetIndexDrawBegin(4,-1);
   SetIndexBuffer(4, v5);
   SetIndexLabel(4,"MA3");

   watermark();

   return(0);
  }

int start()
 {
  double ma1, ma2, ma3;
  int previous;
  int i;
  int shift;
  bool crossed_up, crossed_down;
  int counted_bars = IndicatorCounted();
  if (counted_bars > 0) counted_bars--;
  if (Bars_Count > 0 && Bars_Count <= Bars)
  {
    i = Bars_Count - counted_bars;
  }else{
    i = Bars - counted_bars;
  }

  while(i>=0)
   {
    shift = i + Shift_Bars;
    ma1 = iMA(Symbol(), Period(), MA1_Period, 0, MA1_Type, PRICE_CLOSE, shift+1);
    ma2 = iMA(Symbol(), Period(), MA2_Period, 0, MA2_Type, PRICE_CLOSE, shift+1);
    ma3 = iMA(Symbol(), Period(), MA3_Period, 0, MA3_Type, PRICE_CLOSE, shift+1);
    Comment(ma1, " ", ma2, " ", ma3);
    crossed_up = (ma1 > ma3 && ma2 > ma3);
    crossed_down = (ma1 < ma3 && ma2 < ma3);

    v3[i] = ma1;
    v4[i] = ma2;
    v5[i] = ma3;
    if (crossed_up && previous != 1) {
      v1[i] = Open[shift];
      previous = 1;
    }else if(crossed_down && previous != 2){
      v2[i] = Open[shift];
      previous = 2;
    }

    i--;
   }
  return(0);
 }

//+------------------------------------------------------------------+

void watermark()
  {
   ObjectCreate("fxfisherman", OBJ_LABEL, 0, 0, 0);
   ObjectSetText("fxfisherman", "fxfisherman.com", 11, "Lucida Handwriting", RoyalBlue);
   ObjectSet("fxfisherman", OBJPROP_CORNER, 2);
   ObjectSet("fxfisherman", OBJPROP_XDISTANCE, 5);
   ObjectSet("fxfisherman", OBJPROP_YDISTANCE, 10);
   return(0);
  }
Comments