FastFractals
Download script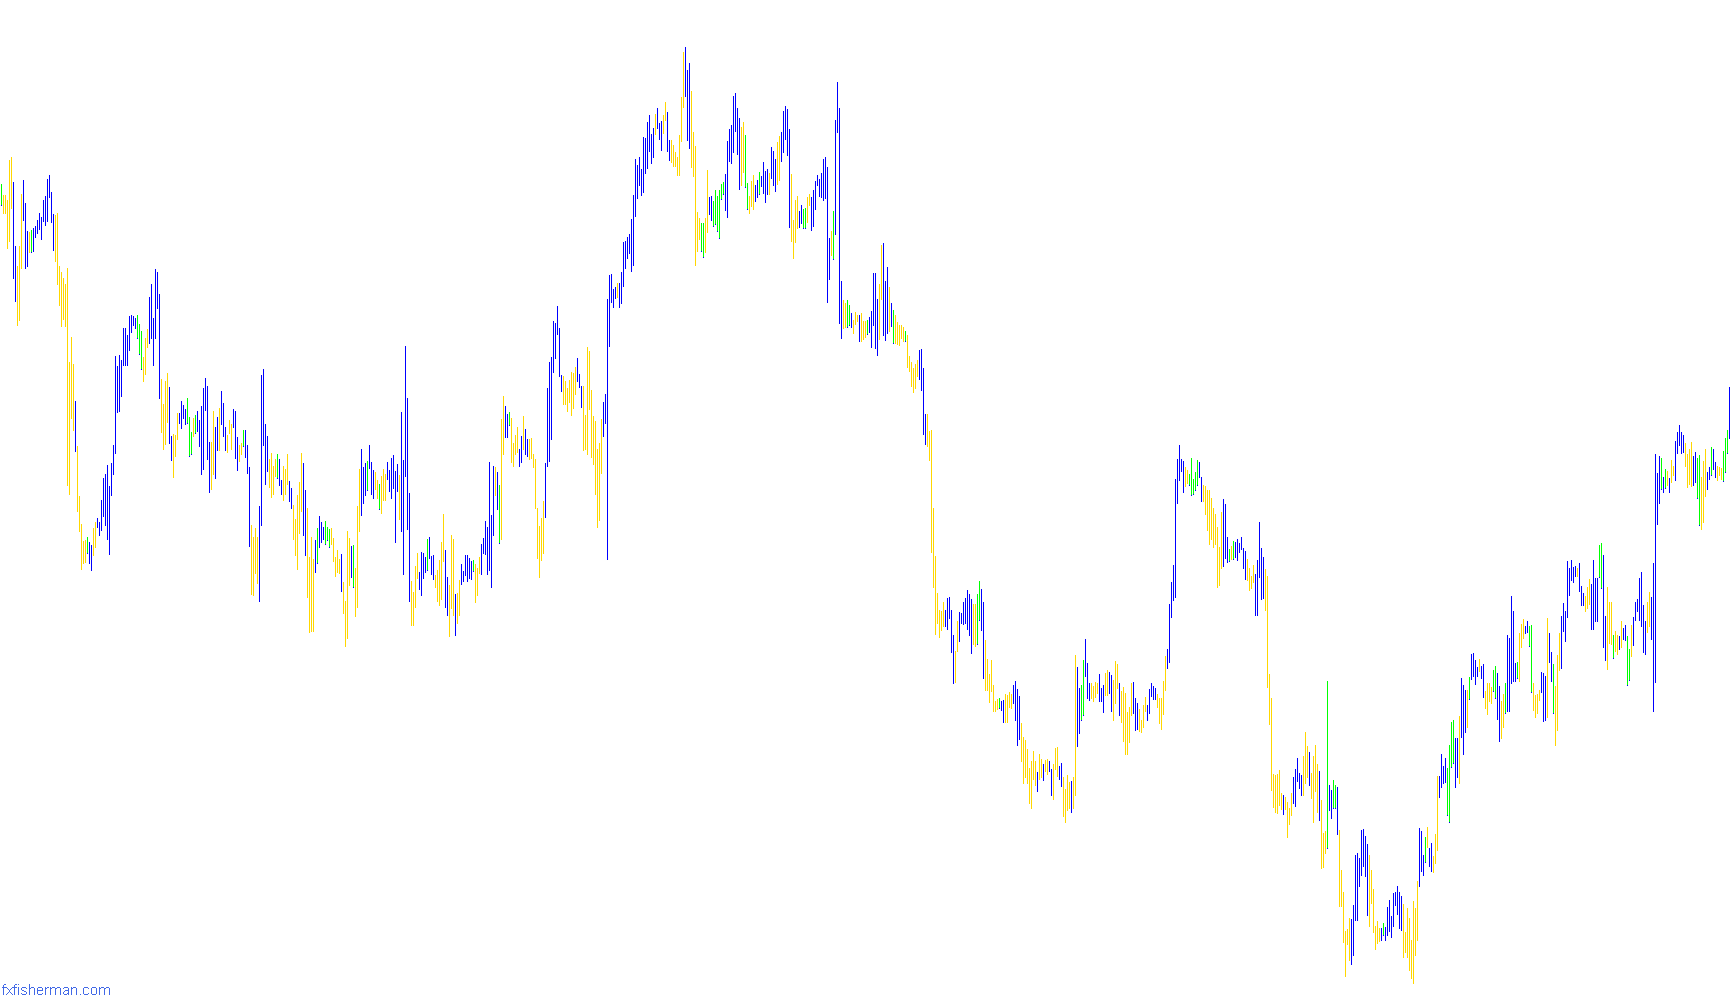
This tool is designed to help traders identify key structural points in the market—specifically areas of "support" and "resistance"—by automatically highlighting specific price patterns on a trading chart. It acts as a visual aid to help you see where the price has historically reversed or paused, making it easier to spot potential trend changes.
How the Logic Works
The script scans your price history and looks for a specific geometric pattern known as a "fractal." Instead of just looking at one single candle, the tool compares a historical price point against its immediate neighbors to determine if it represents a significant peak or valley.
Identifying Peaks (Resistance) The logic looks back at a group of candles to see if a specific high point is higher than the candles directly next to it. If it finds a point where the price "pokes out" above its surrounding area, it identifies this as a potential resistance level. On your chart, these are represented visually to show where the market reached a temporary ceiling.
Identifying Valleys (Support) Similarly, the script scans for "lows." It looks for instances where a specific price point is lower than the candles adjacent to it. When the tool detects this "dip," it identifies it as a potential support level. These are visualized to show where the market found a temporary floor.
Visual Representation The tool processes these findings and paints them onto your chart using two distinct colors:
- Red Indicators: These highlight the primary resistance levels (high points).
- Blue Indicators: These highlight the primary support levels (low points).
Key Features for the User
- Automatic Detection: You don't have to manually hunt for peaks and valleys; the script scans the history and marks them automatically.
- Adjustable Timing: The tool includes a "Shift" setting, which allows you to determine how many bars back from the current price the script should begin its analysis.
- Clear Visual Cues: By using high-contrast colors (Red and Blue), the tool provides an immediate visual map of the market's structure, helping you see the "ups and downs" of the price movement at a glance.
//+------------------------------------------------------------------+
//|                   FractalsPaint.mq4                              |
//|                Copyright © 2006  Scorpion@fxfisherman.com        |
//+------------------------------------------------------------------+
#property copyright "FxFisherman.com"
#property link      "http://www.fxfisherman.com"

#property indicator_chart_window
#property indicator_buffers 2
#property indicator_color1 Red
#property indicator_color2 Blue

extern int Shift_Bars=0;
int Bars_Count= 0;

//---- buffers
double v1[];
double v2[];

int init()
  {

   SetIndexStyle(0,DRAW_HISTOGRAM);
   SetIndexBuffer(0,v1);
   SetIndexStyle(1,DRAW_HISTOGRAM);
   SetIndexBuffer(1,v2);

   watermark();

   return(0);
  }

int start()
 {
  bool hiFractal;
  bool loFractal;
  int curFractal;
  double price;
  int i;
  int shift;
  int counted_bars = IndicatorCounted();
  if (counted_bars > 0) counted_bars--;
  if (Bars_Count > 0 && Bars_Count <= Bars)
  {
    i = Bars_Count - counted_bars;
  }else{
    i = Bars - counted_bars;
  }

  while(i>=0)
   {
    shift = i + Shift_Bars;

    // Resistance
    price = High[shift+3];
    hiFractal = price > High[shift+2] &&
              price > High[shift+1];

    // Support
    price = Low[shift+3];
    loFractal = price < Low[shift+2] &&
              price < Low[shift+1];

    if (hiFractal && !loFractal) {
      curFractal = -1;
    }else if(loFractal && !hiFractal) {
      curFractal = 1;
    }else if(loFractal && hiFractal){
      curFractal = 0;
    }

    if (curFractal == 1) {
      v2[i] = High[i];
      v1[i] = Low[i];
    }else if(curFractal == -1) {
      v1[i] = High[i];
      v2[i] = Low[i];
    }else{
      v1[i] = Low[i];
      v2[i] = Low[i];
    }

    i--;
   }
  return(0);
 }

//+------------------------------------------------------------------+

void watermark()
  {
   ObjectCreate("fxfisherman", OBJ_LABEL, 0, 0, 0);
   ObjectSetText("fxfisherman", "fxfisherman.com", 11, "Lucida Handwriting", RoyalBlue);
   ObjectSet("fxfisherman", OBJPROP_CORNER, 2);
   ObjectSet("fxfisherman", OBJPROP_XDISTANCE, 5);
   ObjectSet("fxfisherman", OBJPROP_YDISTANCE, 10);
   return(0);
  }
Comments