(3) TEST_BARS_GBPJPY_8v1_High
Download script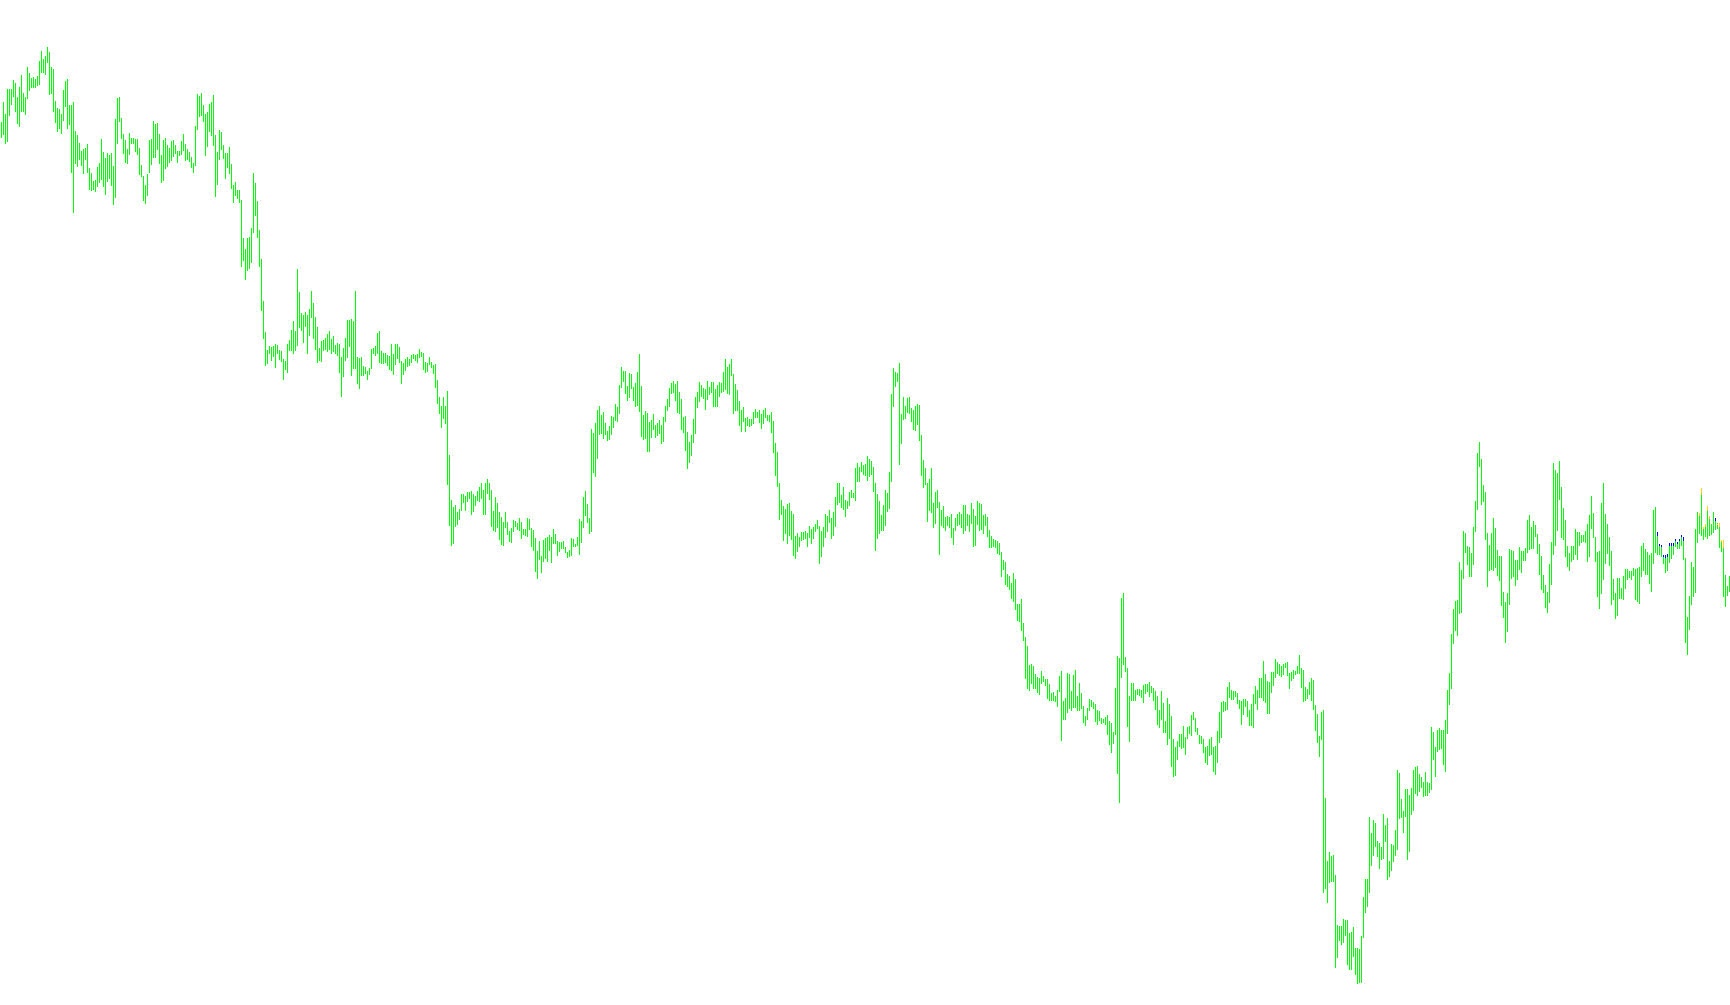
This script is designed as a comprehensive multi-market analysis tool for the MetaTrader platform. Rather than focusing on a single currency pair in isolation, it acts as a "consensus engine" that synthesizes data from multiple global markets to provide a clearer picture of potential price movements.
Core Logic Overview
The primary logic behind this tool is confluence. It looks for agreement across different currency pairs (specifically EURJPY, GBPJPY, USDJPY, and GBPUSD) to identify high-probability trends. Instead of relying on one indicator, it processes eight different data streams simultaneously to filter out market "noise" and provide more reliable signals for the user.
How the Analysis Works
The script functions by monitoring three specific types of technical data:
1. Multi-Pair Momentum Tracking The tool monitors relative strength and momentum across four distinct pairs. It compares these markets against each other to see if they are moving in harmony or opposition. By checking if these pairs are simultaneously bullish or bearish, the script helps identify whether a trend is supported by the broader market or if it is an isolated movement.
2. Directional Strength Comparison A significant portion of the logic is dedicated to comparing "Directional Indicators." It takes specific data points from the GBPJPY, GBPUSD, and USDJPY pairs and creates a weighted average. By comparing these averages, the script determines which market pair is exhibiting the strongest directional force at any given moment.
3. Trend Intensity (ADX Analysis) The script utilizes an Average Directional Index (ADX) to measure the actual strength of a trend regardless of its direction. It calculates these values to determine if the current market movement has enough "velocity" to be considered significant.
Visual Representation and Signals
The results of this complex multi-market calculation are translated into visual signals on your chart:
- Histogram Mapping: The script generates multiple histograms that vary in height based on the strength and direction of the gathered data.
- Dynamic Offsets: Depending on which market conditions are met (e.g., if a trend is strong, weak, positive, or negative), the script calculates specific "offsets" from the high price of the candle.
- Visual Feedback: These offsets are drawn as different colored bars. The goal is to provide a visual representation of "market sentiment"—the more bars that align in a specific direction and intensity, the higher the confidence level in that move.
Summary for the User
Essentially, this tool acts like a "committee" of analysts. It looks at four different markets, checks their momentum, measures their strength against one another, and calculates the velocity of the trends. It then summarizes all that complex data into simple visual bars on your chart, helping you see where the "consensus" of the global market is heading.
//+------------------------------------------------------------------+
//|                                    TEST_BARS_GBPJPY_8v1_High.mq4 |
//| Âíèìàíèå! Äîëæíû ðàáîòàòü ÄÂÀ èíäþêà  TEST_BARS_GBPJPY_8v1_High è  TEST_BARS_GBPJPY_8v1_Low                                        |
//|  ÝÒÎ "ïðîèçâåäåíèå" = äëÿ âå÷íî ñîìíåâàþùèõñÿ, â ñâîèõ äåéñòâèÿõ íà ðûíêå.
//| Â îäèí áàð!!! çàãíàíî 8 âîñåìü èíäèêàòîðîâ !!!          i++ !!!!
//| Âîçìîæíî áóäåò äîðàáàòûâàòüñÿ, à ìîæåò è íåò
//+------------------------------------------------------------------+
#property indicator_chart_window
#property indicator_buffers 8
#property indicator_color1  Blue//Black
#property indicator_color2 Red//Black White
#property indicator_color3 Blue//Blue
#property indicator_color4  Red
#property indicator_color5 Blue //Black
#property indicator_color6 Red//Black White
#property indicator_color7  Blue  //Blue
#property indicator_color8 Red
//----
 extern int ilimit =  555;
//=====================================
//---- input parameters
 extern int  RSI_Period=5;
extern int  RSI_Price =0; // 0=CLOSE 1=OPEN 2=HIGH 3=LOW 4=MEDIAN  5  6
extern int  MA_Period =5;
extern int  MA_Method =3; // 0=SMA 1=EMA 2=SMMA 3=LWMA
extern int ADXPeriod = 12;

//---- buffers
//=====================================

//---- buffers
 double val1[],val2[],val3[],val4[];
 double val11[],val22[],val33[],val44[];
//+------------------------------------------------------------------+
//| Custom indicator initialization function                         |
//+------------------------------------------------------------------+
int init()
  {
   SetIndexStyle(0,DRAW_HISTOGRAM);
   SetIndexBuffer(0,val1);
   SetIndexDrawBegin(0,0);
   SetIndexStyle(1,DRAW_HISTOGRAM);
   SetIndexBuffer(1,val2);
   SetIndexDrawBegin(1,0);
   SetIndexStyle(2,DRAW_HISTOGRAM);
   SetIndexBuffer(2,val3);
   SetIndexDrawBegin(2,0);
   SetIndexStyle(3,DRAW_HISTOGRAM);
   SetIndexBuffer(3,val4);
   SetIndexDrawBegin(3,0);
       SetIndexLabel(0, " ÄÂÈÆÅÍÈÅ  ÄÂÓÕ ÊÐÎÑÑÎÂ ÂÌÅÑÒÅ  " );
       SetIndexLabel(2, " ÄÂÈÆÅÍÈÅ  USDJPY è GBPUSD ÂÌÅÑÒÅ " );
       SetIndexStyle(4,DRAW_HISTOGRAM);
   SetIndexBuffer(4,val11);
   SetIndexDrawBegin(4,0);
   SetIndexStyle(5,DRAW_HISTOGRAM);
   SetIndexBuffer(5,val22);
   SetIndexDrawBegin(5,0);
   SetIndexStyle(6,DRAW_HISTOGRAM);
   SetIndexBuffer(6,val33);
   SetIndexDrawBegin(6,0);
   SetIndexStyle(7,DRAW_HISTOGRAM);
   SetIndexBuffer(7,val44);
   SetIndexDrawBegin(7,0);
    SetIndexLabel(4, "  GBPJPY-r3             " );
    SetIndexLabel(6, "  GBPJPY-r4           " );
   return(0);
  }
//+------------------------------------------------------------------+
int start()
  { double w,ww,w1,ww1, r,rr,r1,rr1, rr2_DI,rr3_DI_S,  r2_ADX ,r3_ADX_S ;
   int limit;
   int counted_bars=IndicatorCounted();
//---- last counted bar will be recounted
   if(counted_bars>0) counted_bars--;
   limit=Bars-counted_bars;
   for(int i=0; i<limit; i++)
{
	r=iCustom("EURJPY",0,"VininI_RSI_FO",RSI_Period,RSI_Price, MA_Period, MA_Method,0,i);
	r1=iCustom("EURJPY",0,"VininI_RSI_FO",RSI_Period,RSI_Price, MA_Period, MA_Method,0,i);
	rr=iCustom("GBPJPY",0,"VininI_RSI_FO",RSI_Period,RSI_Price, MA_Period, MA_Method,0,i);
	rr1=iCustom("GBPJPY",0,"VininI_RSI_FO",RSI_Period,RSI_Price, MA_Period, MA_Method,0,i);
    w=iCustom("USDJPY",0,"VininI_RSI_FO",RSI_Period,RSI_Price, MA_Period, MA_Method,0,i);
	w1=iCustom("USDJPY",0,"VininI_RSI_FO",RSI_Period,RSI_Price, MA_Period, MA_Method,0,i);
	ww=iCustom("GBPUSD",0,"VininI_RSI_FO",RSI_Period,RSI_Price, MA_Period, MA_Method,0,i);
	ww1=iCustom("GBPUSD",0,"VininI_RSI_FO",RSI_Period,RSI_Price, MA_Period, MA_Method,0,i);
//+------------------------------
 if (r>0 && rr>0)
 {
    val1[i]=High[i];    val2[i]=High[i]-(High[i]-Low[i])*0.125;
 }
 if (0>r1 && 0>rr1)
 {
    val1[i]=High[i]-(High[i]-Low[i])*0.125;     val2[i]=High[i];
  }
//+------------------------------
 if (w>0 && ww>0)
 {
   val3[i]=High[i]-(High[i]-Low[i])*0.125;
    val4[i]=High[i]-(High[i]-Low[i])*0.25;
 }
 if (0>w1&&0>ww1)
 {
    val3[i]=High[i]-(High[i]-Low[i])*0.25;
    val4[i]=High[i]-(High[i]-Low[i])*0.125;
 }
//+------------------------------
//==============================================================================
// Â èíäþêå "ADXm",  0 áóôåð = DI,( ðàçíîñòü +DI  è -DI), à 1 áóôåð = ADX ,
//==============================================================================
     rr2_DI =  iCustom("GBPJPY",0,"ADXm",ADXPeriod ,0,0,i);
     rr3_DI_S =iCustom("GBPUSD",0,"ADXm",ADXPeriod ,0, 0, i)*0.5+iCustom("USDJPY",0,"ADXm",ADXPeriod,0,0,i)*0.5;
////  //+------------------------------
     r2_ADX =  iCustom("GBPJPY",0,"ADXm",ADXPeriod*0.5,0,1, i);
     r3_ADX_S = iCustom("GBPUSD",0,"ADXm",ADXPeriod*0.5,0, 1, i)*0.5+ iCustom("USDJPY",0,"ADXm",ADXPeriod*0.5,0,1,i)*0.5;
 //+------------------------------------------------------------------+
//+----------------------------------- &&
if (rr2_DI> rr3_DI_S && rr2_DI > 0 )
{
	val11[i]=High[i]-(High[i]-Low[i])*0.25;
   val22[i]=High[i]-(High[i]-Low[i])*0.375;
}
if (rr2_DI< rr3_DI_S && rr2_DI  < 0 )
{
     val11[i]=High[i]-(High[i]-Low[i])*0.375;
     val22[i]=  High[i]-(High[i]-Low[i])*0.25;
}
//+-----------------------------------
if (r3_ADX_S >0)
{
  val33[i]=High[i]-(High[i]-Low[i])*0.375;
  val44[i]= High[i]-(High[i]-Low[i])*0.5;
}
if ( r3_ADX_S <0)
{
  val33[i]=High[i]-(High[i]-Low[i])*0.5;
  val44[i]= High[i]-(High[i]-Low[i])*0.375;
}
//+-----------------------------------
 }
   return(0);
  }
//+------------------------------------------------------------------+


//+------------------------------------------------------------------+
Comments