3LineBreak_v2
Download script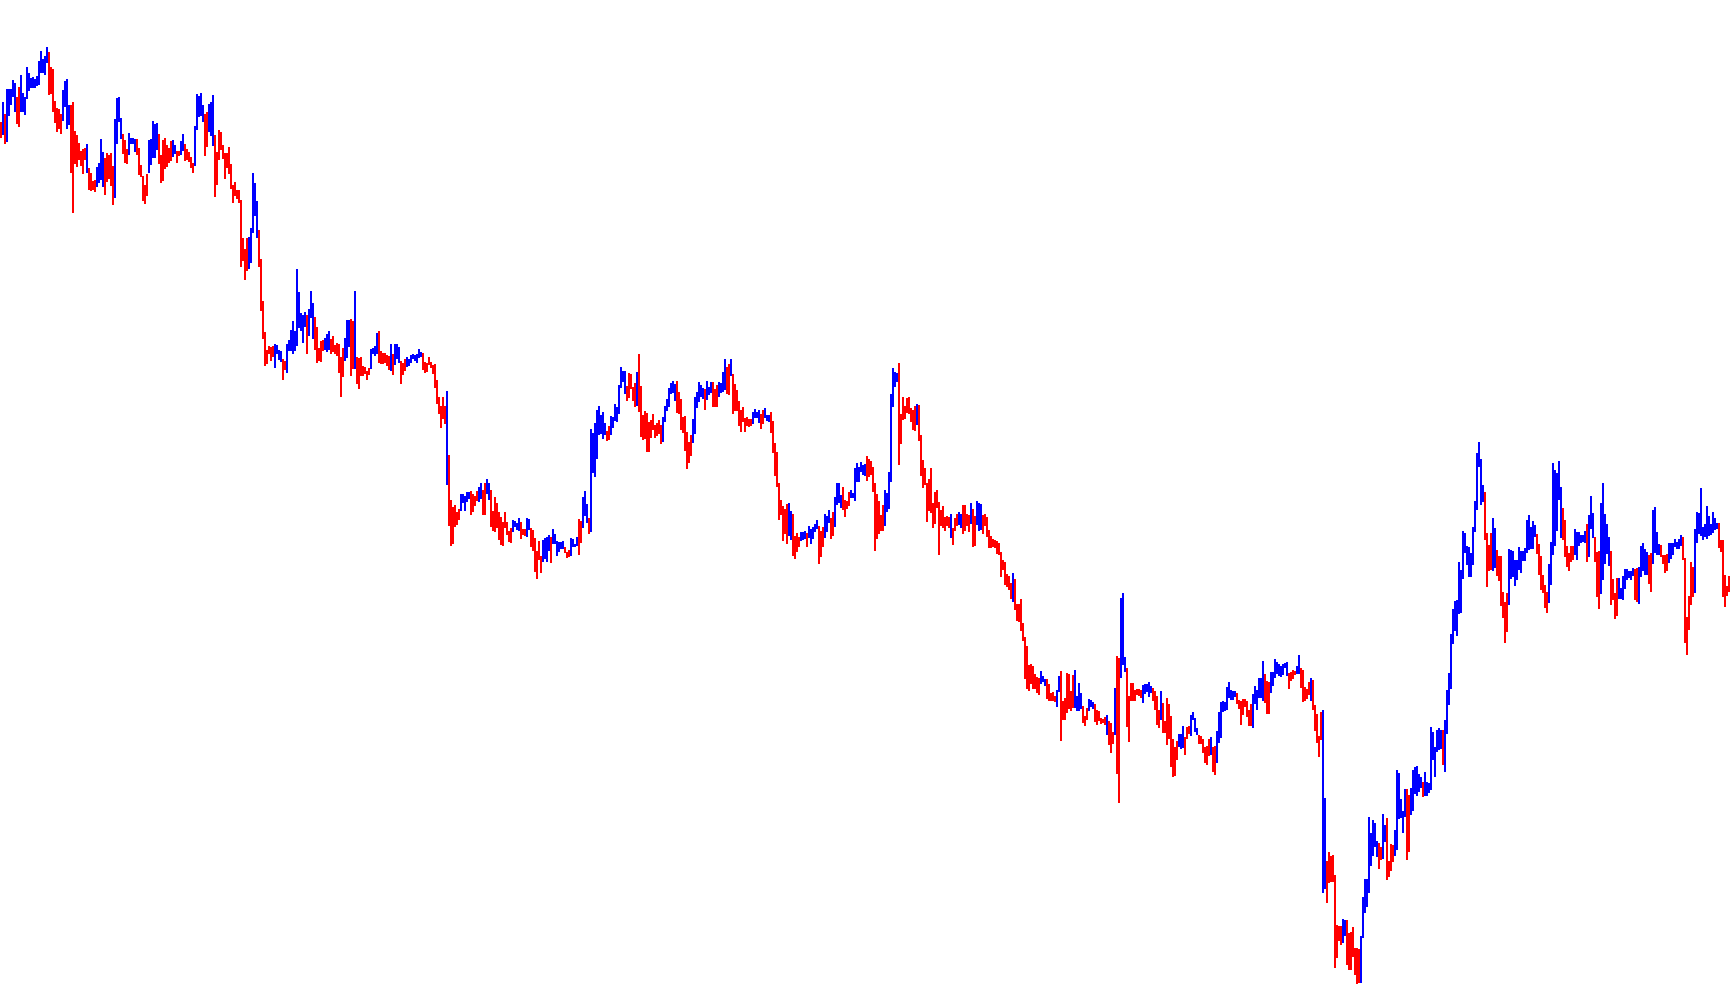
This tool is designed to analyze price movements on a trading chart by identifying specific "breakout" points based on recent price extremes. Instead of showing every minor fluctuation in the market, it focuses on capturing significant shifts in momentum by looking at the highest highs and lowest lows over a user-defined period.
Core Logic and Behavior
The indicator functions by constantly monitoring a specific window of previous price candles (set by the user). It tracks two primary values: the maximum peak and the minimum trough within that timeframe.
How it determines market direction: The logic operates like a "state machine," meaning it keeps track of its current status—whether it believes the market is currently in an upward trend or a downward trend—and only changes that status when a specific price threshold is crossed:
- Switching to Bearish (Downward) Sentiment: If the tool identifies that the market is currently trending up, but the current price drops below the lowest point of the recent lookback period, it "flips" its internal status to bearish.
- Switching to Bullish (Upward) Sentiment: Conversely, if the tool identifies a downward trend but the current price climbs above the highest point of the recent lookback period, it "flips" its status to bullish.
Visual Representation
The indicator translates these internal status changes into visual signals on your chart:
- Trend Identification: When the tool identifies a bullish state, it highlights the price data accordingly. When it identifies a bearish state, it essentially mirrors or highlights the opposite boundaries.
- Dynamic Feedback: By using histograms, the script provides a clear visual distinction between these two states. This allows a trader to see at a glance whether the current market behavior is being categorized as an upward breakout or a downward breakdown based on historical extremes.
In simple terms, this script ignores "noise" and only reacts when the price moves outside of the established boundaries of the recent past, helping traders visualize significant shifts in market structure.
//+------------------------------------------------------------------+
//|                                                   3LineBreak.mq4 |
//|                               Copyright © 2004, Poul_Trade_Forum |
//|                                                         Aborigen |
//|                                          http://forex.kbpauk.ru/ |
//+------------------------------------------------------------------+
#property copyright "Poul Trade Forum"
#property link      "http://forex.kbpauk.ru/"
#property indicator_chart_window
#property indicator_buffers 2
//---- input parameters
extern int Lines_Break = 3;
//---- buffers
double HighBuffer[];
double LowBuffer[];
double VALUE1, VALUE2, Swing=1, OLDSwing;
//+------------------------------------------------------------------+
//| Custom indicator initialization function                         |
//+------------------------------------------------------------------+
int init()
  {
    string short_name;
    //---- indicator line
    SetIndexStyle(0, DRAW_HISTOGRAM, EMPTY, 2, Blue);
    SetIndexStyle(1, DRAW_HISTOGRAM, EMPTY, 2, Red);
    //----
    SetIndexBuffer(0, HighBuffer);
    SetIndexBuffer(1, LowBuffer);
    //----
    SetIndexEmptyValue(0, 0);
    SetIndexEmptyValue(1, 0);
    //---- name for DataWindow and indicator subwindow label
    short_name = "3LineBreak";
    IndicatorShortName(short_name);
    SetIndexLabel(0, short_name);
    //----
    SetIndexDrawBegin(0, 10);
    SetIndexDrawBegin(1, 10);
    //----
    return(0);
  }
//+------------------------------------------------------------------+
//| Custor indicator deinitialization function                       |
//+------------------------------------------------------------------+
int deinit()
  {
//----
   return(0);
  }
//+------------------------------------------------------------------+
//| Custom indicator iteration function                              |
//+------------------------------------------------------------------+
int start()
  {
    int counted_bars = IndicatorCounted(), i, shift;
    //---- TODO: add your code here
    if(counted_bars == 0)
        counted_bars = Lines_Break + 1;
    i = (Bars - counted_bars);
    //----
    for(shift = i; shift >= 0; shift--)
      {
        OLDSwing = Swing;
        VALUE1 = High[Highest(NULL, 0, MODE_HIGH, Lines_Break, shift + 1)];
        VALUE2 = Low[Lowest(NULL, 0, MODE_LOW, Lines_Break, shift + 1)];
        if(OLDSwing == 1 &&  Low[shift] < VALUE2)
            Swing = -1;
        if(OLDSwing == -1 && High[shift] > VALUE1 )
            Swing = 1;
        if(Swing == 1)
          {
            HighBuffer[shift] = High[shift];
            LowBuffer[shift] = Low[shift];
          }
        if(Swing == -1)
          {
            LowBuffer[shift] = High[shift];
            HighBuffer[shift] = Low[shift];
          }
        //----
      }
    return(0);
  }
//+------------------------------------------------------------------+
Comments