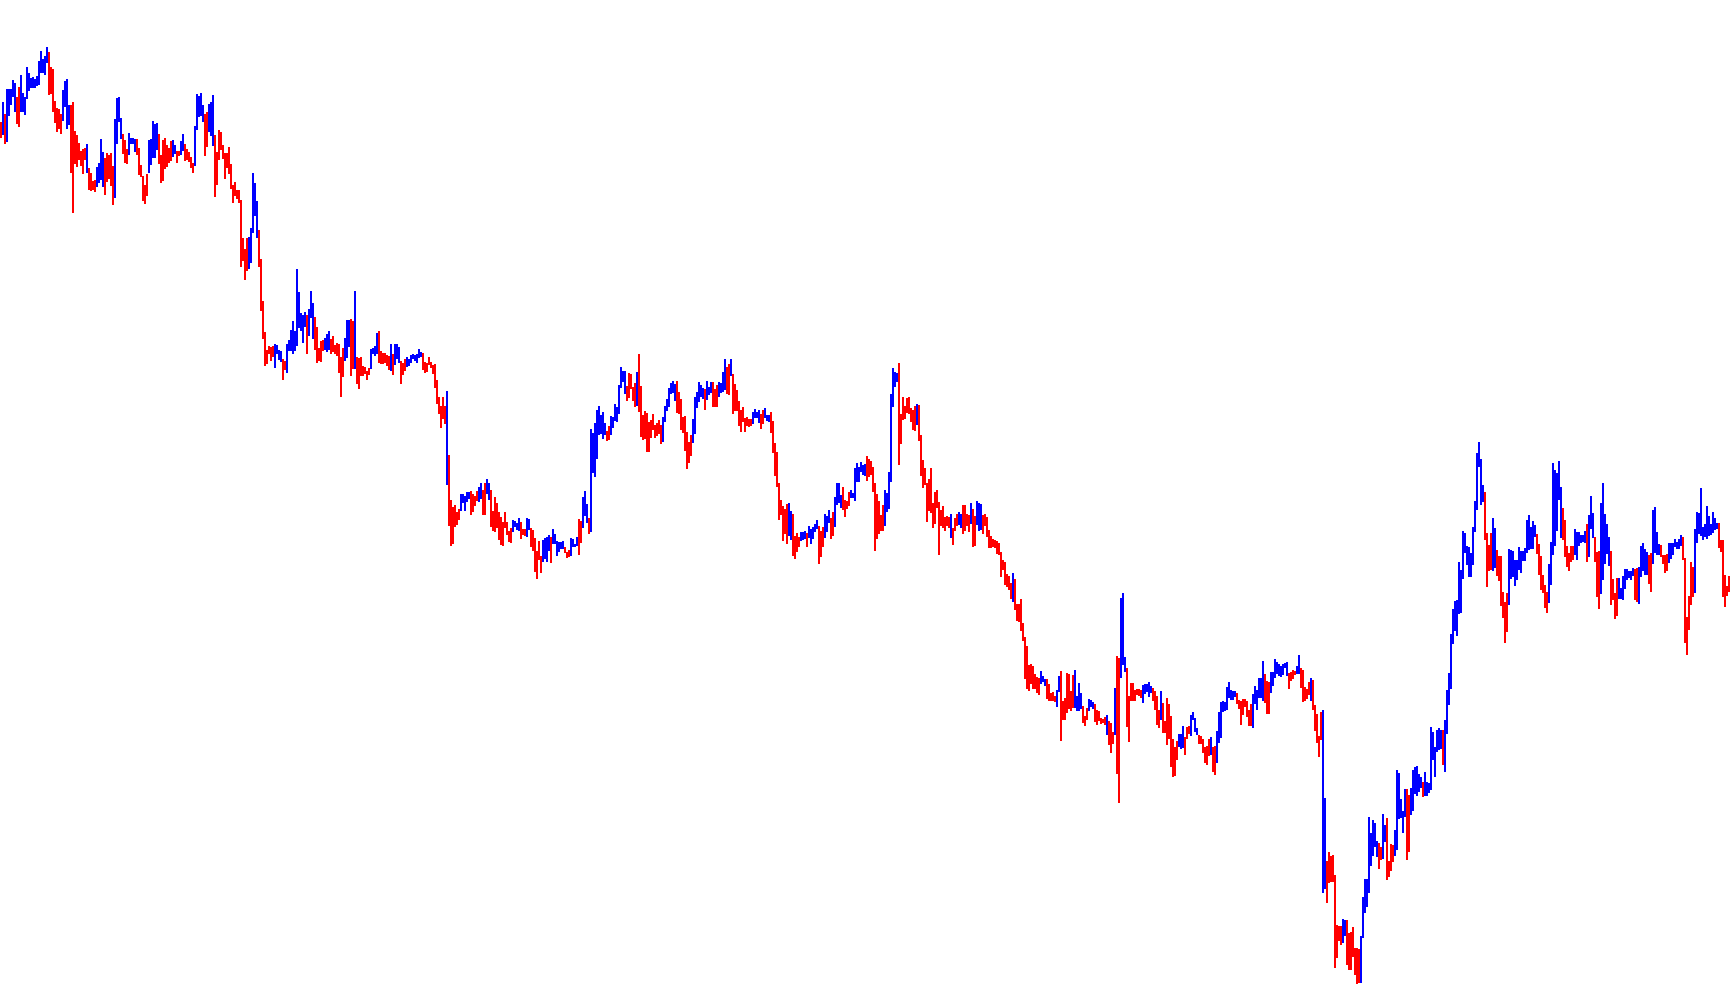
The 3LineBreak indicator is a visual trading tool designed to help market participants identify significant trend shifts and structural "breaks" in price action. Rather than focusing on minor fluctuations, this script focuses on identifying clear momentum by observing how the price interacts with recent highs and lows over a specific number of bars.
How the Logic Works
The core functionality of the indicator relies on a "swing" detection system. Here is a breakdown of the logic in plain English:
1. Establishing the Lookback Range The user can define a specific number of price bars to analyze (set by default to 3). The tool looks at this recent window of history to identify the highest peak and the lowest valley reached during that period.
2. Identifying Trend Reversals The script constantly monitors the relationship between the current market price and the extremes identified in that lookback range:
- Bullish Momentum: If the price moves above the highest high of the previous period, the system recognizes this as a potential upward "break" or swing toward the upside.
- Bearish Momentum: If the price drops below the lowest low of the previous period, the system identifies a downward "break" or swing toward the downside.
3. Visual Representation Once the script detects a change in direction (a "swing"), it updates its internal state to reflect that new trend. It then displays this data on your chart using two distinct colors:
- Blue Histograms: These represent periods where the market is exhibiting upward momentum based on the break of recent highs.
- Red Histograms: These represent periods where the market is exhibiting downward momentum based on the break of recent lows.
Practical Summary for Traders
This tool acts as a filter to help smooth out "market noise." Instead of reacting to every tiny candle movement, it waits for the price to actually surpass a significant structural level (the highest high or lowest low of the last few bars). When that threshold is crossed, the indicator visually signals a change in trend direction, allowing you to see the prevailing market structure more clearly at a glance.
/*-----------------------------+
|			       |
| Shared by www.Aptrafx.com    |
|			       |
+------------------------------*/

//+------------------------------------------------------------------+
//|                                                   3LineBreak.mq4 |
//|                               Copyright © 2004, Poul_Trade_Forum |
//|                                                         Aborigen |
//|                                          http://forex.kbpauk.ru/ |
//+------------------------------------------------------------------+
#property copyright "Poul Trade Forum"
#property link      "http://forex.kbpauk.ru/"
#property indicator_chart_window
#property indicator_buffers 2

//---- input parameters
extern int Lines_Break=3;
//---- buffers
double HighBuffer[];
double LowBuffer[];
double VALUE1,VALUE2,Swing=1,OLDSwing;
//+------------------------------------------------------------------+
//| Custom indicator initialization function                         |
//+------------------------------------------------------------------+
int init()
  {
   string short_name;
//---- indicator line
   SetIndexStyle(0,DRAW_HISTOGRAM,EMPTY,2,Blue);
   SetIndexStyle(1,DRAW_HISTOGRAM,EMPTY,2,Red);

   SetIndexBuffer(0,HighBuffer);
   SetIndexBuffer(1,LowBuffer);

   SetIndexEmptyValue(0,0);
   SetIndexEmptyValue(1,0);

//---- name for DataWindow and indicator subwindow label
   short_name="3LineBreak";
   IndicatorShortName(short_name);
   SetIndexLabel(0,short_name);

//----
   SetIndexDrawBegin(0,10);
   SetIndexDrawBegin(1,10);
//----

   return(0);
  }
//+------------------------------------------------------------------+
//| Custor indicator deinitialization function                       |
//+------------------------------------------------------------------+
int deinit()
  {
//---- TODO: add your code here

//----
   return(0);
  }
//+------------------------------------------------------------------+
//| Custom indicator iteration function                              |
//+------------------------------------------------------------------+
int start()
  {
   int    counted_bars=IndicatorCounted(),i,shift;


//---- TODO: add your code here
if (counted_bars==0) counted_bars=Lines_Break+1;
i=(Bars-counted_bars);

for (shift=i; shift>=0;shift--)
{

OLDSwing=Swing;

VALUE1=High[Highest(NULL,0,MODE_HIGH,Lines_Break,shift+1)];
VALUE2= Low[Lowest(NULL,0,MODE_LOW,Lines_Break,shift+1)];
if (OLDSwing==1 &&  Low[shift]<VALUE2) Swing=-1;
if (OLDSwing==-1 && High[shift]>VALUE1 ) Swing=1;

if (Swing==1)
{ HighBuffer[shift]=High[shift]; LowBuffer[shift]=Low[shift]; }

if (Swing==-1)
{ LowBuffer[shift]=High[shift]; HighBuffer[shift]=Low[shift]; }


 //----
}
   return(0);
  }
//+------------------------------------------------------------------+
Comments