5Min_01a
Download script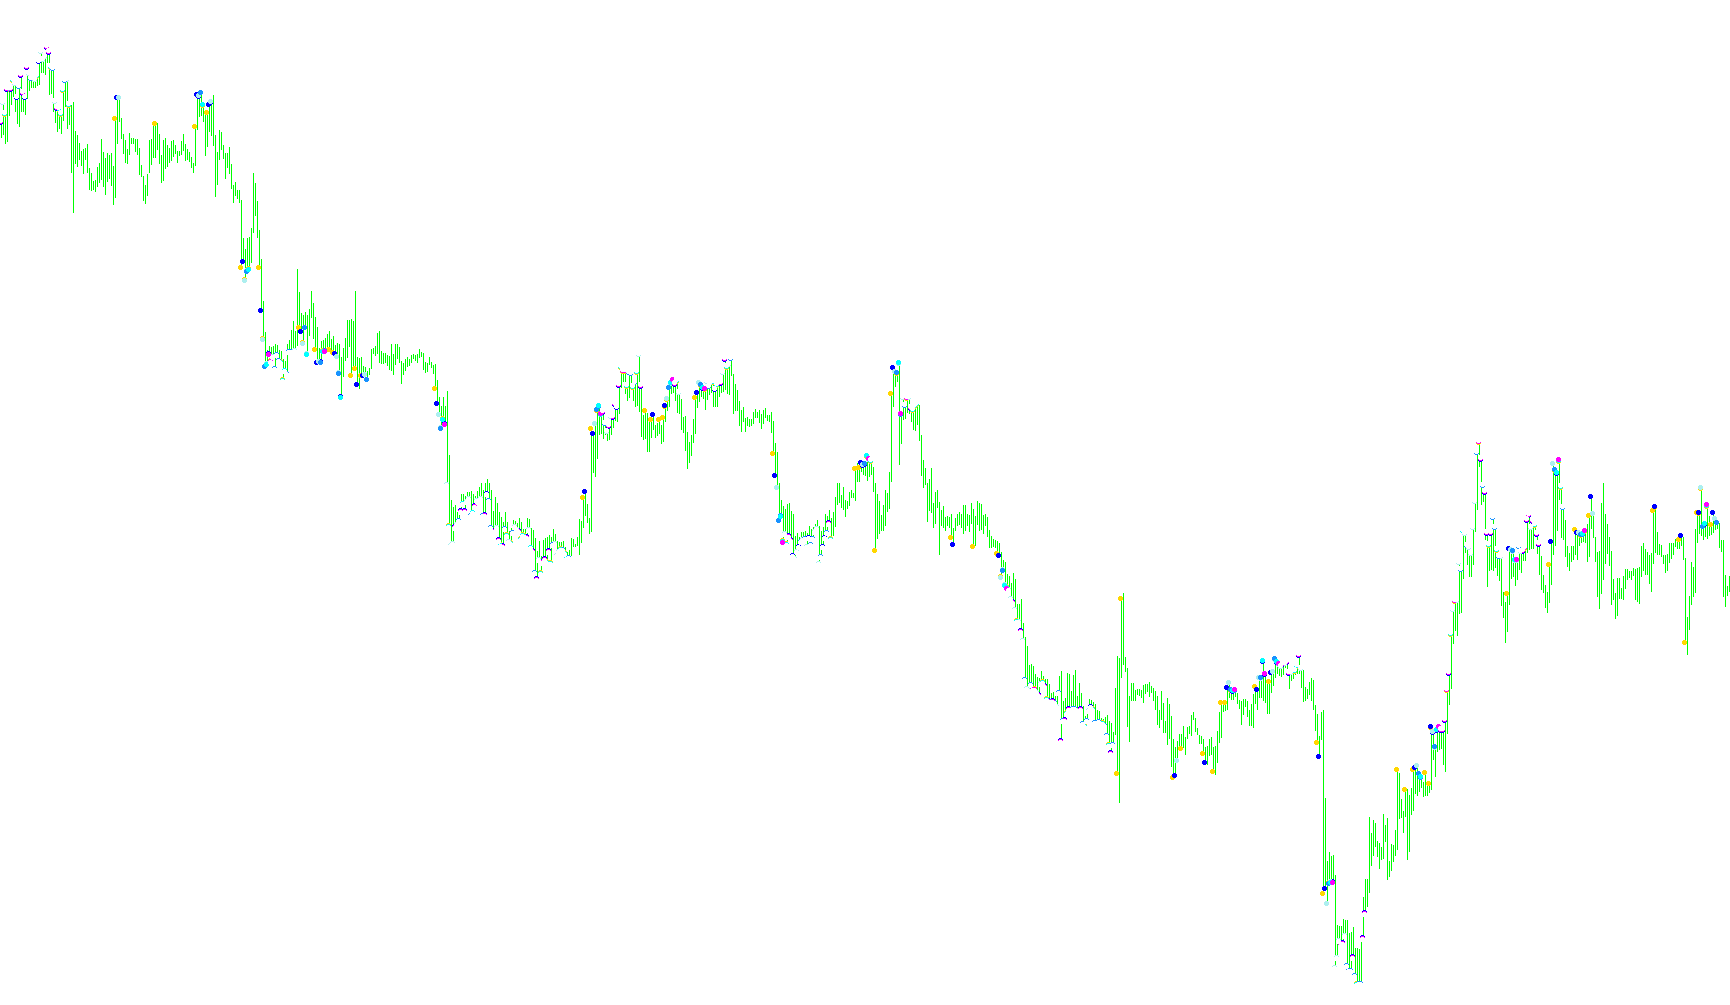
This tool is designed for traders who want to visualize specific momentum patterns and "overextended" price action directly on their trading charts. By analyzing the Relative Strength Index (RSI)—a common technical indicator that measures the speed and change of price movements—this script identifies when a market trend becomes unusually aggressive or begins to Exhaust.
How the Logic Works
The core logic of this script revolves around identifying "chains" of momentum. Instead of looking at just one moment in time, it examines the last eight consecutive bars of price data to see how many of them stay consistently above or below specific threshold levels.
1. Momentum Tracking (The Thresholds) The script establishes two key boundaries for the RSI:
- Upper Boundary: Values above 53 are considered high-momentum zones.
- Lower Boundary: Values below 43 are considered low-momentum zones.
2. Chain Detection The script scans backward through the chart to count how many consecutive bars meet these criteria:
- Upward Chains: If one bar is above the upper boundary, it notes a level of "1." If two consecutive bars stay above it, it moves to "2," and so on, up to a maximum chain of 8.
- Downward Chains: Similarly, if bars fall below the lower boundary, it counts these consecutive occurrences (e.g., -1, -2, all the way to -8).
3. Visual Signal Generation Once the script detects a qualifying chain, it places visual markers (dots) on your chart to highlight the strength of that move:
- Bullish Momentum: When an upward chain is detected, dots appear above the price candles. The more consecutive "high-momentum" bars there are, the higher the dots stack vertically, creating a visual staircase effect. This represents a sustained period of buying pressure.
- Bearish Momentum: When a downward chain is detected, dots appear below the price candles. Just like the bullish side, these also stack vertically to show how many consecutive "low-momentum" bars have occurred, representing a sustained period of selling pressure.
Summary for the Trader
Think of this indicator as a momentum counter. It doesn't just tell you that the price is moving; it tells you how long the current move has been persisting. By looking at the height of the stacked dots, you can quickly gauge whether a trend is gaining significant steam or if it is reaching a point of extreme exhaustion where a reversal might be looming.
//+------------------------------------------------------------------+
//| 10 Minute trader                                                 |
//+------------------------------------------------------------------+
#property copyright "Ron T"
#property link      "http://www.lightpatch.com"

#property indicator_chart_window
#property indicator_buffers 7
#property indicator_color1 HotPink  // arrow up
#property indicator_color2 HotPink  // arrow down
#property indicator_color3 Aqua
#property indicator_color4 Red
#property indicator_color5 White
#property indicator_color6 HotPink
#property indicator_color7 LimeGreen
#property indicator_color8 White

//---- buffers
double ExtMapBuffer1[];
double ExtMapBuffer2[];
double ExtMapBuffer3[];
double ExtMapBuffer4[];
double ExtMapBuffer5[];
double ExtMapBuffer6[];
double ExtMapBuffer7[];
double ExtMapBuffer8[];

//+------------------------------------------------------------------+
//| Custom indicator initialization function                         |
//|------------------------------------------------------------------|

int init()
  {

   // 233 up arrow
   // 234 down arrow
   // 159 big dot
   // 168 open square

   SetIndexStyle(0,DRAW_ARROW);
   SetIndexBuffer(0, ExtMapBuffer1);
   SetIndexArrow(0,159);

   SetIndexStyle(1,DRAW_ARROW);
   SetIndexBuffer(1, ExtMapBuffer2);
   SetIndexArrow(1,159);

   SetIndexStyle(2,DRAW_ARROW);
   SetIndexBuffer(2, ExtMapBuffer3);
   SetIndexArrow(2,159);

   SetIndexStyle(3,DRAW_ARROW);
   SetIndexBuffer(3, ExtMapBuffer4);
   SetIndexArrow(3,159);

   SetIndexStyle(4,DRAW_ARROW);
   SetIndexBuffer(4, ExtMapBuffer5);
   SetIndexArrow(4,159);

   SetIndexStyle(5,DRAW_ARROW);
   SetIndexBuffer(5, ExtMapBuffer6);
   SetIndexArrow(5,159);

   SetIndexStyle(6,DRAW_ARROW);
   SetIndexBuffer(6, ExtMapBuffer7);
   SetIndexArrow(6,159);

   SetIndexStyle(7,DRAW_ARROW);
   SetIndexBuffer(7, ExtMapBuffer8);
   SetIndexArrow(7,159);

   return(0);
  }


//+------------------------------------------------------------------+
//| Custor indicator deinitialization function                       |
//+------------------------------------------------------------------+
int deinit()
  {
   int i;

   for( i=0; i<Bars; i++ ) ExtMapBuffer1[i]=0;
   for( i=0; i<Bars; i++ ) ExtMapBuffer2[i]=0;
   for( i=0; i<Bars; i++ ) ExtMapBuffer3[i]=0;
   for( i=0; i<Bars; i++ ) ExtMapBuffer4[i]=0;
   for( i=0; i<Bars; i++ ) ExtMapBuffer5[i]=0;
   for( i=0; i<Bars; i++ ) ExtMapBuffer6[i]=0;
   for( i=0; i<Bars; i++ ) ExtMapBuffer7[i]=0;
   for( i=0; i<Bars; i++ ) ExtMapBuffer8[i]=0;

   return(0);
  }


//+------------------------------------------------------------------+
//| Custom indicator iteration function                              |
//+------------------------------------------------------------------+
int start()
  {
   double   draw=0;
   int      heit=0;

   double rsimin=43;
   double rsimax=53;

   double   rsi0=0;              // Relative Strength Indicator
   double   rsi1=0,     rsi2=0;  // long chain rsi 1&2
   double   rsi3=0,     rsi4=0;  // long chain rsi 3&4
   double   rsi5=0,     rsi6=0;  // long chain rsi 1&2
   double   rsi7=0,     rsi8=0;  // long chain rsi 3&4

   double p=Point();

   int pos=Bars-100;             // leave room for moving average periods

   while(pos>=0)
     {
      rsi0=iRSI(Symbol(),0,28,PRICE_CLOSE,pos+0);
      rsi1=iRSI(Symbol(),0,28,PRICE_CLOSE,pos+1);
      rsi2=iRSI(Symbol(),0,28,PRICE_CLOSE,pos+2);
      rsi3=iRSI(Symbol(),0,28,PRICE_CLOSE,pos+3);
      rsi4=iRSI(Symbol(),0,28,PRICE_CLOSE,pos+4);
      rsi5=iRSI(Symbol(),0,28,PRICE_CLOSE,pos+5);
      rsi6=iRSI(Symbol(),0,28,PRICE_CLOSE,pos+6);
      rsi7=iRSI(Symbol(),0,28,PRICE_CLOSE,pos+7);

      heit=0;

      if (rsi0>rsimax) heit=1;
      if (rsi0>rsimax && rsi1>rsimax) heit=2;
      if (rsi0>rsimax && rsi1>rsimax && rsi2>rsimax) heit=3;
      if (rsi0>rsimax && rsi1>rsimax && rsi2>rsimax && rsi3>rsimax) heit=4;
      if (rsi0>rsimax && rsi1>rsimax && rsi2>rsimax && rsi3>rsimax && rsi4>rsimax) heit=5;
      if (rsi0>rsimax && rsi1>rsimax && rsi2>rsimax && rsi3>rsimax && rsi4>rsimax && rsi5>rsimax) heit=6;
      if (rsi0>rsimax && rsi1>rsimax && rsi2>rsimax && rsi3>rsimax && rsi4>rsimax && rsi5>rsimax && rsi6>rsimax) heit=7;
      if (rsi0>rsimax && rsi1>rsimax && rsi2>rsimax && rsi3>rsimax && rsi4>rsimax && rsi5>rsimax && rsi6>rsimax && rsi7<rsimin) heit=8;

      if (rsi0<rsimin) heit=-1;
      if (rsi0<rsimin && rsi1<rsimin) heit=-2;
      if (rsi0<rsimin && rsi1<rsimin && rsi2<rsimin) heit=-3;
      if (rsi0<rsimin && rsi1<rsimin && rsi2<rsimin && rsi3<rsimin) heit=-4;
      if (rsi0<rsimin && rsi1<rsimin && rsi2<rsimin && rsi3<rsimin && rsi4<rsimin) heit=-5;
      if (rsi0<rsimin && rsi1<rsimin && rsi2<rsimin && rsi3<rsimin && rsi4<rsimin && rsi5<rsimin) heit=-6;
      if (rsi0<rsimin && rsi1<rsimin && rsi2<rsimin && rsi3<rsimin && rsi4<rsimin && rsi5<rsimin && rsi6<rsimin) heit=-7;
      if (rsi0<rsimin && rsi1<rsimin && rsi2<rsimin && rsi3<rsimin && rsi4<rsimin && rsi5<rsimin && rsi6<rsimin && rsi7<rsimin) heit=-8;


      if (heit>0)
        {
         switch (heit)
         {
          case 1:
             ExtMapBuffer1[pos]=High[pos]+(p*1);
             break;
          case 2:
             ExtMapBuffer1[pos]=High[pos]+(p*1);
             ExtMapBuffer2[pos]=High[pos]+(p*2);
             break;
          case 3:
             ExtMapBuffer1[pos]=High[pos]+(p*1);
             ExtMapBuffer2[pos]=High[pos]+(p*2);
             ExtMapBuffer3[pos]=High[pos]+(p*3);
             break;
          case 4:
             ExtMapBuffer1[pos]=High[pos]+(p*1);
             ExtMapBuffer2[pos]=High[pos]+(p*2);
             ExtMapBuffer3[pos]=High[pos]+(p*3);
             ExtMapBuffer4[pos]=High[pos]+(p*4);
             break;
          case 5:
             ExtMapBuffer1[pos]=High[pos]+(p*1);
             ExtMapBuffer2[pos]=High[pos]+(p*2);
             ExtMapBuffer3[pos]=High[pos]+(p*3);
             ExtMapBuffer4[pos]=High[pos]+(p*4);
             ExtMapBuffer5[pos]=High[pos]+(p*5);
             break;
          case 6:
             ExtMapBuffer1[pos]=High[pos]+(p*1);
             ExtMapBuffer2[pos]=High[pos]+(p*2);
             ExtMapBuffer3[pos]=High[pos]+(p*3);
             ExtMapBuffer4[pos]=High[pos]+(p*4);
             ExtMapBuffer5[pos]=High[pos]+(p*5);
             ExtMapBuffer6[pos]=High[pos]+(p*6);
             break;
          case 7:
             ExtMapBuffer1[pos]=High[pos]+(p*1);
             ExtMapBuffer2[pos]=High[pos]+(p*2);
             ExtMapBuffer3[pos]=High[pos]+(p*3);
             ExtMapBuffer4[pos]=High[pos]+(p*4);
             ExtMapBuffer5[pos]=High[pos]+(p*5);
             ExtMapBuffer6[pos]=High[pos]+(p*6);
             ExtMapBuffer7[pos]=High[pos]+(p*7);
             break;
          case 8:
             ExtMapBuffer1[pos]=High[pos]+(p*1);
             ExtMapBuffer2[pos]=High[pos]+(p*2);
             ExtMapBuffer3[pos]=High[pos]+(p*3);
             ExtMapBuffer4[pos]=High[pos]+(p*4);
             ExtMapBuffer5[pos]=High[pos]+(p*5);
             ExtMapBuffer6[pos]=High[pos]+(p*6);
             ExtMapBuffer7[pos]=High[pos]+(p*7);
             ExtMapBuffer8[pos]=High[pos]+(p*8);
             break;
         }
        }

      if (heit<0)
        {
         switch (heit)
         {
          case -1:
             ExtMapBuffer1[pos]=Low[pos]-(p*1);
             break;
          case -2:
             ExtMapBuffer1[pos]=Low[pos]-(p*1);
             ExtMapBuffer2[pos]=Low[pos]-(p*2);
             break;
          case -3:
             ExtMapBuffer1[pos]=Low[pos]-(p*1);
             ExtMapBuffer2[pos]=Low[pos]-(p*2);
             ExtMapBuffer3[pos]=Low[pos]-(p*3);
             break;
          case -4:
             ExtMapBuffer1[pos]=Low[pos]-(p*1);
             ExtMapBuffer2[pos]=Low[pos]-(p*2);
             ExtMapBuffer3[pos]=Low[pos]-(p*3);
             ExtMapBuffer4[pos]=Low[pos]-(p*4);
             break;
          case -5:
             ExtMapBuffer1[pos]=Low[pos]-(p*1);
             ExtMapBuffer2[pos]=Low[pos]-(p*2);
             ExtMapBuffer3[pos]=Low[pos]-(p*3);
             ExtMapBuffer4[pos]=Low[pos]-(p*4);
             ExtMapBuffer5[pos]=Low[pos]-(p*5);
             break;
          case -6:
             ExtMapBuffer1[pos]=Low[pos]-(p*1);
             ExtMapBuffer2[pos]=Low[pos]-(p*2);
             ExtMapBuffer3[pos]=Low[pos]-(p*3);
             ExtMapBuffer4[pos]=Low[pos]-(p*4);
             ExtMapBuffer5[pos]=Low[pos]-(p*5);
             ExtMapBuffer6[pos]=Low[pos]-(p*6);
             break;
          case -7:
             ExtMapBuffer1[pos]=Low[pos]-(p*1);
             ExtMapBuffer2[pos]=Low[pos]-(p*2);
             ExtMapBuffer3[pos]=Low[pos]-(p*3);
             ExtMapBuffer4[pos]=Low[pos]-(p*4);
             ExtMapBuffer5[pos]=Low[pos]-(p*5);
             ExtMapBuffer6[pos]=Low[pos]-(p*6);
             ExtMapBuffer7[pos]=Low[pos]-(p*7);
             break;
          case -8:
             ExtMapBuffer1[pos]=Low[pos]-(p*1);
             ExtMapBuffer2[pos]=Low[pos]-(p*2);
             ExtMapBuffer3[pos]=Low[pos]-(p*3);
             ExtMapBuffer4[pos]=Low[pos]-(p*4);
             ExtMapBuffer5[pos]=Low[pos]-(p*5);
             ExtMapBuffer6[pos]=Low[pos]-(p*6);
             ExtMapBuffer7[pos]=Low[pos]-(p*7);
             ExtMapBuffer8[pos]=Low[pos]-(p*8);
             break;
         }
        }

 	   pos--;
     }

   return(0);
  }
//+------------------------------------------------------------------+
Comments