AbsoluteStrength_v1.1_001
Download script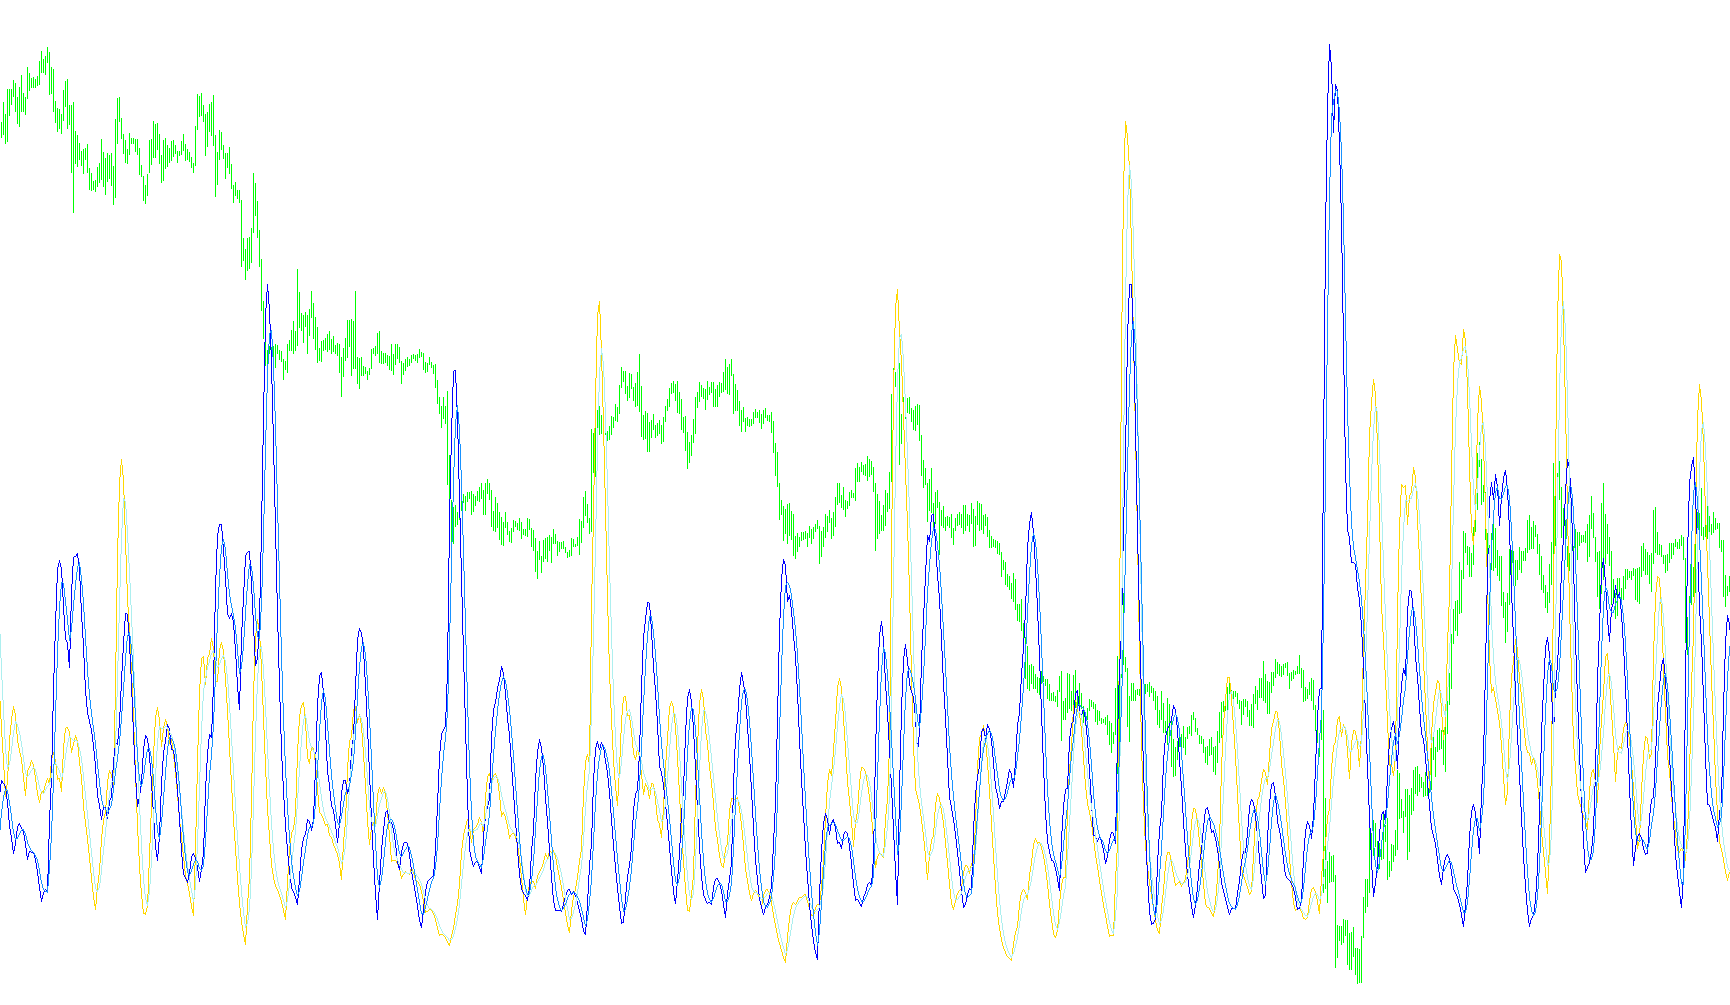
The AbsoluteStrength indicator is designed to measure and visualize the relative strength of market momentum by separating "bullish" (buying) force from "bearish" (selling) force. Instead of just showing where the price is, it attempts to quantify how much pressure is behind a specific move.
Core Logic and Methodology
The script operates by calculating two primary values: Bulls and Bears. These represent the intensity of upward and downward movements, respectively. The logic follows three distinct "Modes" that you can choose from to determine how this strength is calculated:
- RSI Method: This focuses on the change in price direction. It measures the difference between the current price and the previous price, then separates that movement into positive (bullish) and negative (bearish) components.
- Stochastic Method: This compares the current price against the highest high and lowest low over a specific period. It calculates how much room is left for the price to move upward or downward relative to its recent range.
- ADX Method: This looks specifically at the volatility of the highs and lows, calculating the strength of the movement by comparing the distance between consecutive high points and consecutive low points.
Data Processing Pipeline
Once the raw Bull and Bear values are calculated based on your chosen mode, the script puts them through a multi-stage refinement process to make the data easier for a human trader to read:
- Averaging: The raw scores are smoothed using a Moving Average. This removes "noise" (minor, insignificant price flickers) and highlights the underlying trend.
- Smoothing: The averaged data is smoothed a second time. This creates a fluid line that reflects the sustained momentum of the market rather than sudden spikes.
- Signal Generation: Finally, the script generates "Signal" lines. These are derived from the smoothed data to help identify significant trends. If specific "OverBought" or "OverSold" limits are set by the user, these signals will scale based on those thresholds; otherwise, they provide a secondary moving average of the momentum to act as a visual guide.
Visual Interpretation
The indicator provides four distinct lines on your chart:
- Bulls/Bears: These represent the primary raw strength of the market trends.
- SignalBulls/SignalBears: These serve as the secondary guides, helping you identify when the strength is becoming overextended or where a trend might be gaining definitive weight.
By observing these lines together, traders can visually identify which side of the market (buyers or sellers) currently holds the "Absolute Strength," allowing for a clearer understanding of market sentiment beyond simple price action.
//+------------------------------------------------------------------+
//|                                        AbsoluteStrength_v1.1.mq4 |
//|                           Copyright © 2006, TrendLaboratory Ltd. |
//|            http://finance.groups.yahoo.com/group/TrendLaboratory |
//|                                       E-mail: igorad2004@list.ru |
//+------------------------------------------------------------------+
#property copyright "Copyright © 2006, TrendLaboratory Ltd."
#property link      "http://finance.groups.yahoo.com/group/TrendLaboratory"

#property indicator_separate_window
#property indicator_buffers   4
#property indicator_color1    Blue //SmthBulls
#property indicator_width1    2
#property indicator_color2    Red //SmthBears
#property indicator_width2    2
#property indicator_color3    RoyalBlue //SigBulls
#property indicator_width3    1
#property indicator_style3    2
#property indicator_color4    Tomato //SigBears
#property indicator_width4    1
#property indicator_style4    2
//---- input parameters
extern int       Mode       =  0; // 0-RSI method; 1-Stoch method; 2-ADX method
extern int       Length     = 10; // Period of evaluation
extern int       Smooth     =  5; // Period of smoothing
extern int       Signal     =  5; // Period of Signal Line
extern int       Price      =  0; // Price mode : 0-Close,1-Open,2-High,3-Low,4-Median,5-Typical,6-Weighted
extern int       ModeMA     =  3; // Mode of Moving Average
extern double    OverBought =  0; // OverBought Level
extern double    OverSold   =  0; // OverSold Level

//---- buffers
double Bulls[];
double Bears[];
double AvgBulls[];
double AvgBears[];
double SmthBulls[];
double SmthBears[];
double SigBulls[];
double SigBears[];

//+------------------------------------------------------------------+
//| Custom indicator initialization function                         |
//+------------------------------------------------------------------+
int init()
  {
//---- indicators
   IndicatorBuffers(8);
   SetIndexStyle(0,DRAW_LINE);//Blue
   SetIndexBuffer(0,SmthBulls);

   SetIndexStyle(1,DRAW_LINE);//Red
   SetIndexBuffer(1,SmthBears);

   SetIndexStyle(2,DRAW_LINE);//RoyalBlue
   SetIndexBuffer(2,SigBulls);

   SetIndexStyle(3,DRAW_LINE);//Tomato
   SetIndexBuffer(3,SigBears);

   SetIndexBuffer(4,Bulls);
   SetIndexBuffer(5,Bears);
   SetIndexBuffer(6,AvgBulls);
   SetIndexBuffer(7,AvgBears);

//---- name for DataWindow and indicator subwindow label
   string short_name="AbsoluteStrength("+Mode+","+Length+","+Smooth+","+Signal+",,"+ModeMA+")";
   IndicatorShortName(short_name);
   SetIndexLabel(0,"Bulls");
   SetIndexLabel(1,"Bears");
   SetIndexLabel(2,"SignalBulls");
   SetIndexLabel(3,"SignalBears");
//----
   SetIndexDrawBegin(0,Length+Smooth+Signal);
   SetIndexDrawBegin(1,Length+Smooth+Signal);
   SetIndexDrawBegin(2,Length+Smooth+Signal);
   SetIndexDrawBegin(3,Length+Smooth+Signal);

   return(0);
  }

//+------------------------------------------------------------------+
//| Custom indicator iteration function                              |
//+------------------------------------------------------------------+
int start()
  {

   int      shift, limit, counted_bars=IndicatorCounted();
   double   Price1, Price2, smax, smin;

//----
   if ( counted_bars < 0 ) return(-1);
   if ( counted_bars ==0 ) limit=Bars-Length+Smooth+Signal-1;
   if ( counted_bars < 1 )

   for(int i=1;i<Length+Smooth+Signal;i++)
   {
    Bulls[Bars-i]=0;
    Bears[Bars-i]=0;
    AvgBulls[Bars-i]=0;
    AvgBears[Bars-i]=0;
    SmthBulls[Bars-i]=0;
    SmthBears[Bars-i]=0;
    SigBulls[Bars-i]=0;
    SigBears[Bars-i]=0;
   }


   if(counted_bars>0) limit=Bars-counted_bars;
   limit--;

   for( shift=limit; shift>=0; shift--)
      {
       Price1 = iMA(NULL,0,1,0,0,Price,shift);
       Price2 = iMA(NULL,0,1,0,0,Price,shift+1);

         if (Mode==0)
         {
          Bulls[shift] = 0.5*(MathAbs(Price1-Price2)+(Price1-Price2));
          Bears[shift] = 0.5*(MathAbs(Price1-Price2)-(Price1-Price2));
         }

         if (Mode==1)
         {
          smax=High[Highest(NULL,0,MODE_HIGH,Length,shift)];
          smin=Low[Lowest(NULL,0,MODE_LOW,Length,shift)];

          Bulls[shift] = Price1 - smin;
          Bears[shift] = smax - Price1;
         }

         if (Mode==2)
         {
          Bulls[shift] = 0.5*(MathAbs(High[shift]-High[shift+1])+(High[shift]-High[shift+1]));
          Bears[shift] = 0.5*(MathAbs(Low[shift+1]-Low[shift])+(Low[shift+1]-Low[shift]));
         }


      }

      for( shift=limit; shift>=0; shift--)
      {
       AvgBulls[shift]=iMAOnArray(Bulls,0,Length,0,ModeMA,shift);
       AvgBears[shift]=iMAOnArray(Bears,0,Length,0,ModeMA,shift);
      }

      for( shift=limit; shift>=0; shift--)
      {
       SmthBulls[shift]=iMAOnArray(AvgBulls,0,Smooth,0,ModeMA,shift);
       SmthBears[shift]=iMAOnArray(AvgBears,0,Smooth,0,ModeMA,shift);
      }

      for( shift=limit; shift>=0; shift--)
      {
         if (OverBought > 0 && OverSold > 0 )
         {
          SigBulls[shift]=OverBought/100*(SmthBulls[shift]+SmthBears[shift]);
          SigBears[shift]=OverSold/100*(SmthBulls[shift]+SmthBears[shift]);
         }
         else
         {
          SigBulls[shift]=iMAOnArray(SmthBulls,0,Signal,0,ModeMA,shift);
          SigBears[shift]=iMAOnArray(SmthBears,0,Signal,0,ModeMA,shift);
         }
      }
//----
   return(0);
  }
//+------------------------------------------------------------------+
Comments