acc_dist_graph_eur
Download script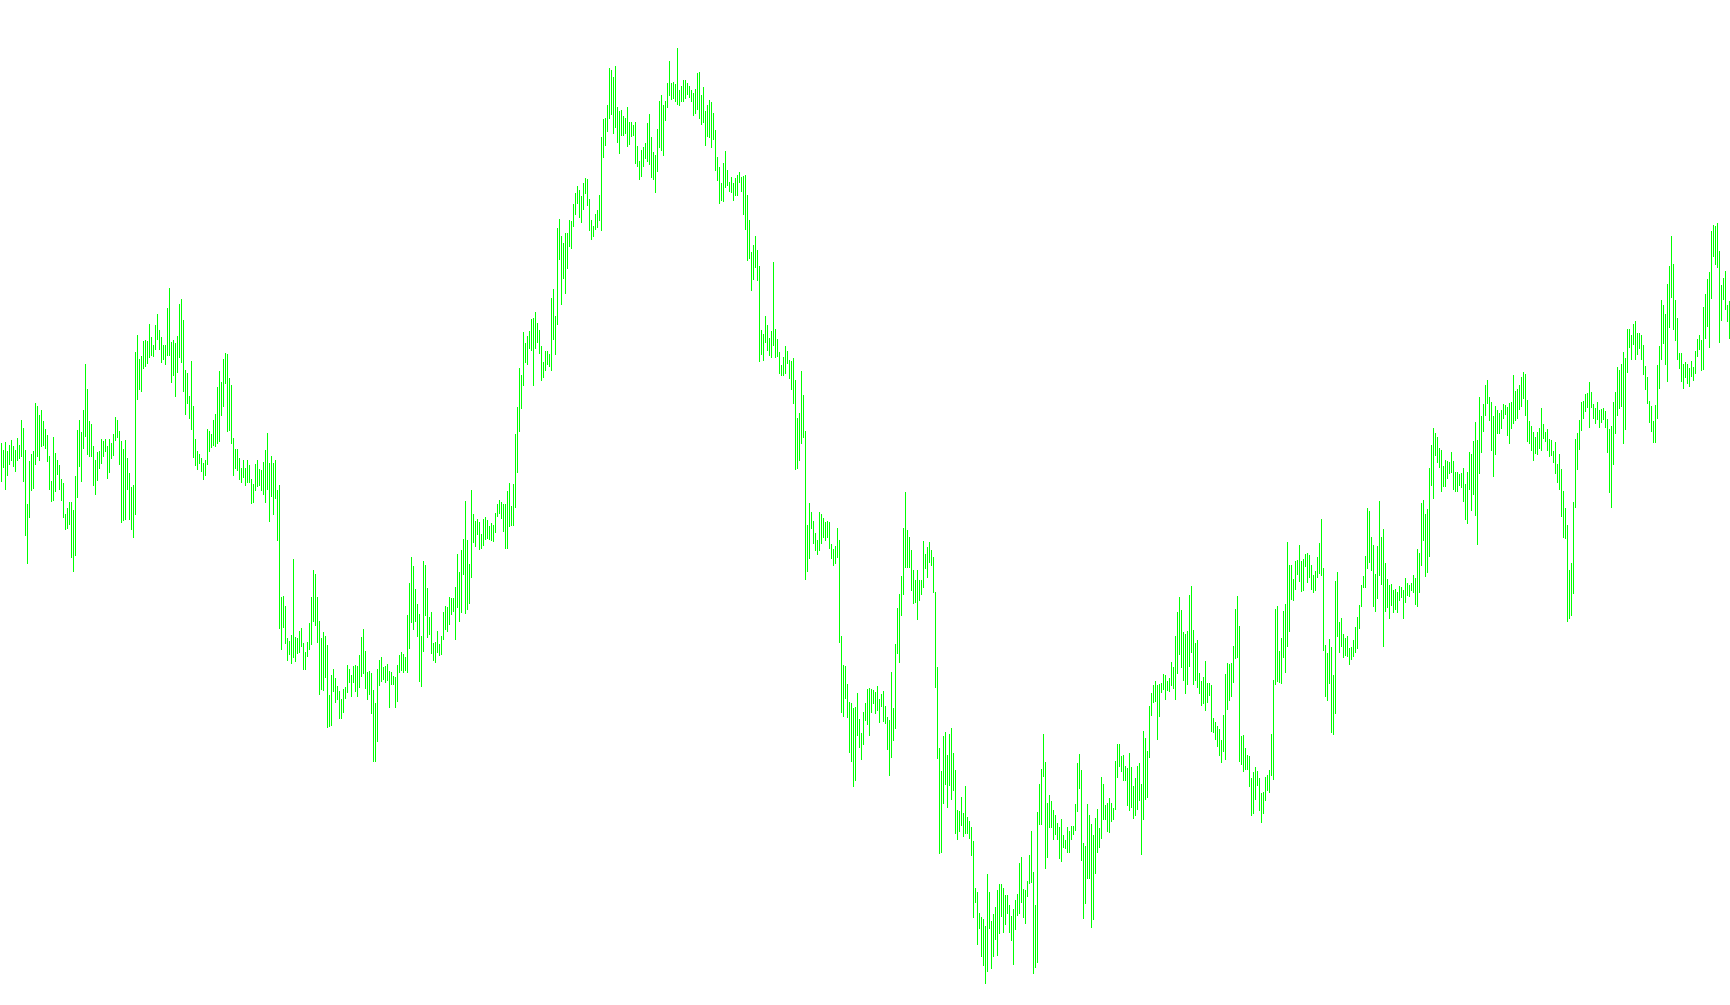
This tool is designed to provide a high-level overview of the Euro (EUR) currency's performance by aggregating data from four major trading pairs simultaneously. Instead of looking at just one market, it combines multiple perspectives to create a unified visual representation of the currency's strength or movement.
How the Logic Works
The core functionality of this script relies on three main steps:
1. Multi-Market Data Collection The indicator monitors four specific currency pairs involving the Euro:
- EUR/USD
- EUR/GBP
- EUR/JPY
- EUR/CHF
By tracking these four pairs, the tool captures how the Euro is performing against different global economies (the United States, the United Kingdom, Japan, and Switzerland) at the same time.
2. Time-Based Analysis The tool uses a specific "Momentum Period" (defined by the user) to look back at historical price movements. It systematically scans through these recent bars of data to gather the necessary information for each individual currency pair independently.
3. Aggregated Summation Once the data from all four pairs is collected, the script performs a mathematical summation. It adds the values of all four pairs together into a single combined figure. This total is then plotted on your chart as a single continuous line.
What this means for the user
Rather than having to analyze four different charts to understand the Euro's current direction, this indicator simplifies the process. By merging these markets into one visual output, it helps you see the "cumulative" trend of the Euro across various major global markets in a single glance.
#property copyright "Copyright © 2009, sHrung."
#property link      "http://www.something.com/"

#property indicator_separate_window
#property indicator_buffers 1
#property indicator_color1 Yellow

//---- input parameters
extern int MomPeriod=1000;
//---- buffers
//--- currencies
double EUR[];

//---
double ac_eurusd[];
double ac_eurgbp[], ac_eurjpy[];
double ac_eurchf[];

//+------------------------------------------------------------------+
//| Custom indicator initialization function                         |
//+------------------------------------------------------------------+
int init()
  {
   string short_name;
   //---- additional buffers used for counting.
  IndicatorBuffers(5);


//---- indicator line
   SetIndexStyle(0,DRAW_LINE);
   SetIndexBuffer(0,EUR);
   SetIndexBuffer(1,ac_eurgbp);
   SetIndexBuffer(2,ac_eurusd);
   SetIndexBuffer(3,ac_eurchf);
   SetIndexBuffer(4,ac_eurjpy);


//---- name for DataWindow and indicator subwindow label
   short_name="Accu/Dist Graph EUR ("+MomPeriod+")";
   IndicatorShortName(short_name);
   SetIndexLabel(0,"EUR");
//----
   SetIndexDrawBegin(0,MomPeriod);
//----
   return(0);
  }
//+------------------------------------------------------------------+
//| Four legs                                                        |
//+------------------------------------------------------------------+
int start()
  {
   int i,counted_bars=IndicatorCounted();
   int a, b, c, d, e, f, g, h, ii, j;
//----
   if(Bars<=MomPeriod) return(0);
//---- initial zero
   if(counted_bars<1)
      for(i=1;i<=MomPeriod;i++) EUR[Bars-i]=0.0;
//----

   int limib=Bars-counted_bars;
   if(counted_bars>1) limib++;
   for(b=0; b<MomPeriod; b++)
   ac_eurusd[b] = iAD("EURUSD",0,b);


   int limie=Bars-counted_bars;
   if(counted_bars>1) limie++;
   for(e=0; e<MomPeriod; e++)
   ac_eurgbp[e] = iAD("EURGBP",0,e);

   int limif=Bars-counted_bars;
   if(counted_bars>1) limif++;
   for(f=0; f<MomPeriod; f++)
   ac_eurjpy[f] = iAD("EURJPY",0,f);

   int limig=Bars-counted_bars;
   if(counted_bars>1) limig++;
   for(g=0; g<MomPeriod; g++)
   ac_eurchf[g] = iAD("EURCHF",0,g);

//----
//----
   i=Bars-MomPeriod-1;
   if(counted_bars>=MomPeriod) i=Bars-counted_bars-1;
   while(i>=0)
     {
EUR[i] = ac_eurusd[i] + ac_eurgbp[i] + ac_eurjpy[i] + ac_eurchf[i];

    i--;
     }
   return(0);
  }
//+------------------------------------------------------------------+
Comments