Close-Low
Download script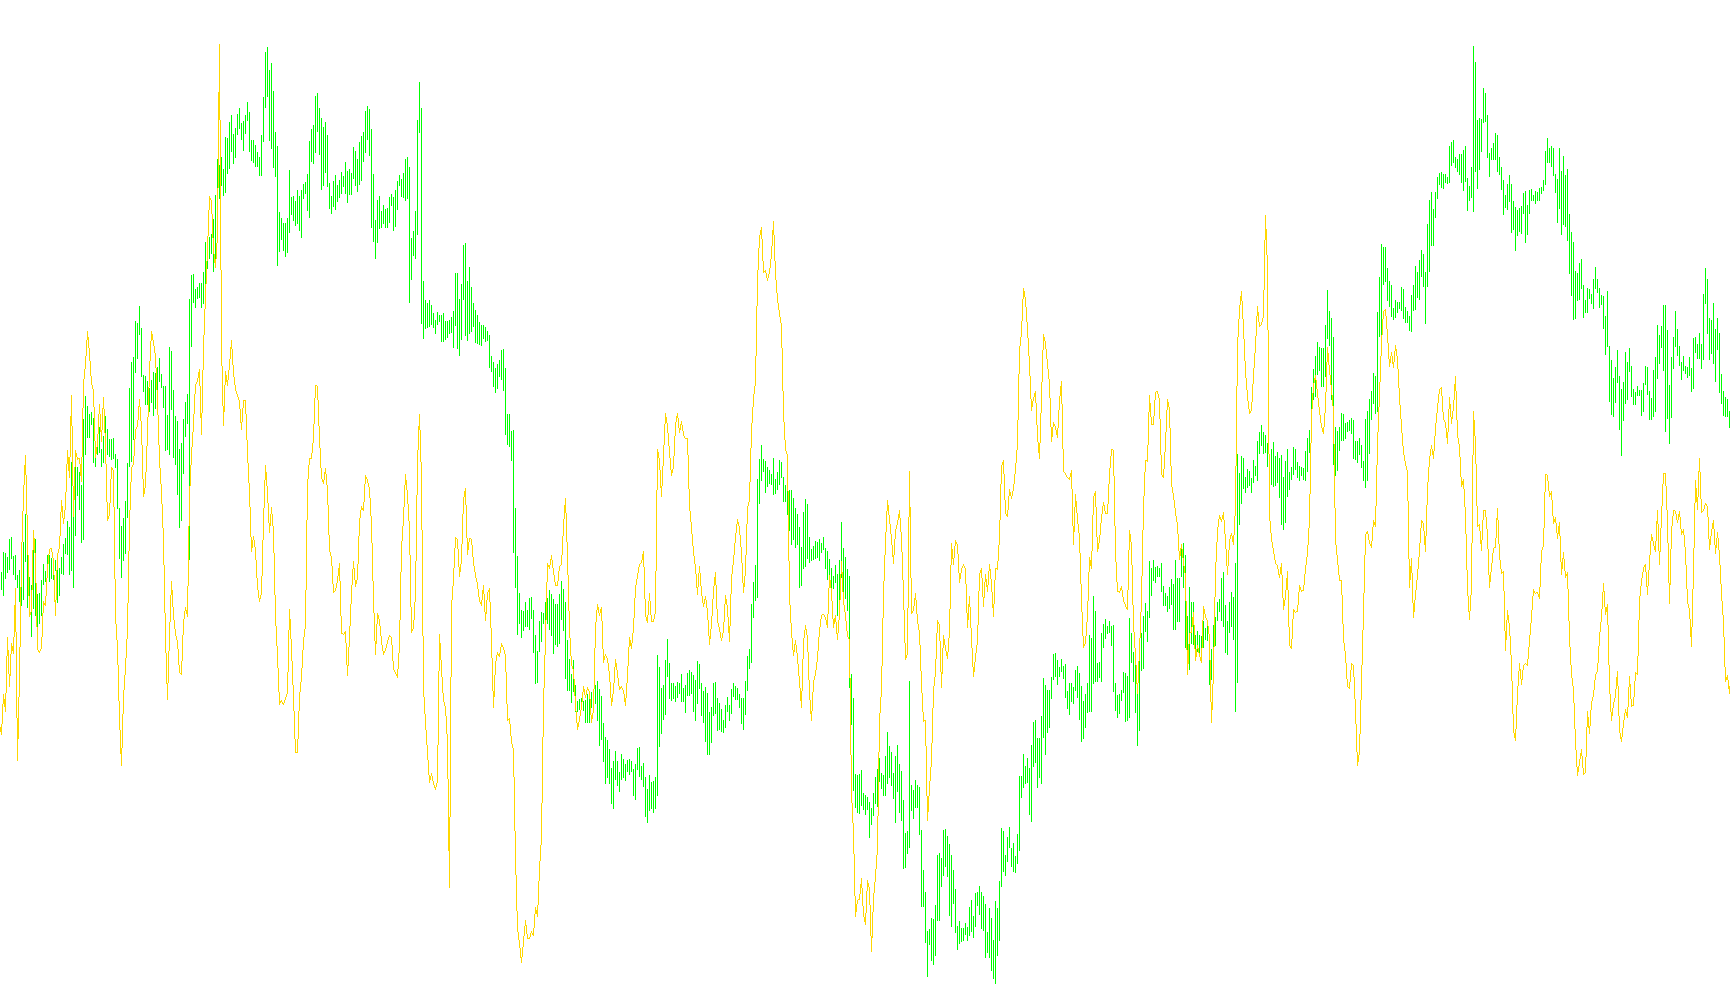
This custom indicator is designed to provide visual data on your trading chart by analyzing the relationship between specific price points over a set timeframe. Instead of focusing on standard price movement alone, it calculates a ratio to help traders understand the vertical spread of the market over a specific duration.
Core Functionality
The logic operates based on a user-defined period (set by default to 15). It looks at two distinct price points:
- The High Price: It identifies the highest point reached in the current candle.
- The Past Low Price: It looks back exactly one "period" (e.g., 15 candles ago) to identify the lowest price reached at that specific moment in history.
The Calculation Logic
The indicator performs a mathematical division between these two points. Specifically, it takes the current high price and divides it by the low price from the previous period.
By performing this calculation, the tool produces a unique value that represents the expansion of price relative to where the market was a set number of candles ago. This allows you to see how much the current "peak" deviates from a historical "floor."
Visual Representation
- Data Window: The results are displayed in a separate window below your main price chart, rather than being overlaid directly on the candles.
- Line Movement: The output is rendered as a continuous white line. This allows you to observe trends in the ratio; for example, a rising line indicates that current highs are moving significantly higher compared to previous lows, while a falling line suggests a contraction or downward trend in price reach.
- Initialization: The indicator requires a minimum amount of historical data (equal to your chosen period) before it begins plotting, ensuring that the calculation always has a valid "past low" to reference.
//+------------------------------------------------------------------+
//|                 This has been coded by MT-Coder                  |
//|                                                                  |
//|                     Email: mt-coder@hotmail.com                  |
//|                      Website: mt-coder.110mb.com                 |
//|                                                                  |
//| For a price I can code for you any strategy you have in mind     |
//|            into EA, I can code any indicator you have in mind    |
//|                                                                  |
//|          Don't hesitate to contact me at mt-coder@hotmail.com    |
//+------------------------------------------------------------------+


#property copyright "Copyright © 2009, MT-Coder."
#property link      "http://mt-coder.110mb.com/"

#property indicator_separate_window
#property indicator_buffers 1
#property indicator_color1 White

//---- input parameters
extern int CLPeriod=15;
//---- buffers
double MainBuffer[];
double TempBuffer[];
//+------------------------------------------------------------------+
//| Custom indicator initialization function                         |
//+------------------------------------------------------------------+
int init()
  {
   string short_name;
   //---- 1 additional buffer used for counting.
   IndicatorBuffers(2);
   IndicatorDigits(Digits);
//---- indicator line
   SetIndexStyle(0,DRAW_LINE);
   SetIndexBuffer(0,MainBuffer);
   SetIndexBuffer(1,TempBuffer);


//---- name for DataWindow and indicator subwindow label
   short_name="Close-Low by mt-coder@hotmail.com ("+CLPeriod+")";
   IndicatorShortName(short_name);
   SetIndexLabel(0,"Close-Low");

//----
   SetIndexDrawBegin(0,CLPeriod);

//----
   return(0);
  }
//+------------------------------------------------------------------+
//| Four legs                                                        |
//+------------------------------------------------------------------+
int start()
  {
   int i,counted_bars=IndicatorCounted();
//----
   if(Bars<=CLPeriod) return(0);
//---- initial zero
   if(counted_bars<1)
     // for(i=1;i<=CLPeriod;i++) MomBuffer[Bars-i]=0.0;
//----
//----
   int limit=Bars-counted_bars;
   if(counted_bars>0) limit++;
   for(i=0; i<limit; i++)
      TempBuffer[i]=iMA(NULL,0,CLPeriod,0,MODE_SMA,PRICE_CLOSE,i);
//----
   i=Bars-CLPeriod-1;
   if(counted_bars>=CLPeriod) i=Bars-counted_bars-1;
   while(i>=0)
     {


      MainBuffer[i]=MathPow(High[i],1)/MathPow(Low[i+CLPeriod],1);

      i--;
     }
   return(0);
  }
//+------------------------------------------------------------------+
Comments