Adaptive RSI_v1
Download script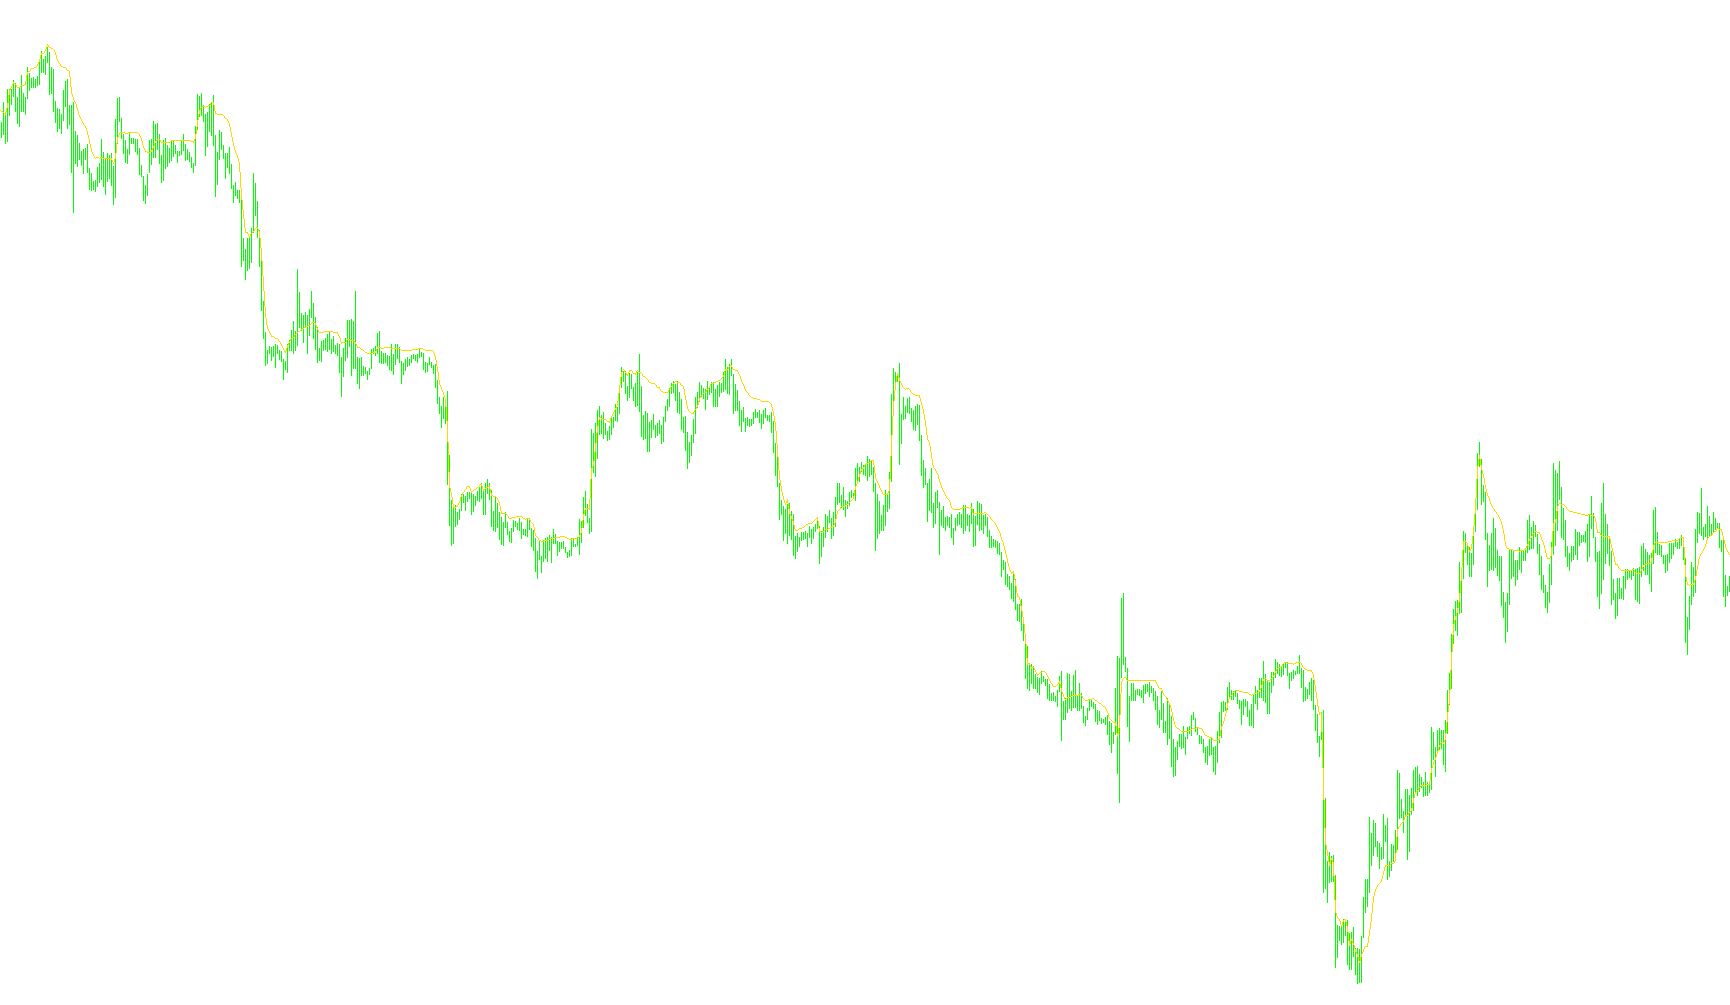
This script functions as a custom technical analysis tool designed to help traders visualize market momentum and price trends in a dedicated sub-window. Unlike standard indicators that might only show raw data, this logic focuses on smoothing the relationship between price movements and relative strength.
Core Functionality
The script works by analyzing the "Relative Strength Index" (RSI)—a common measure of whether an asset is overbought or oversold—and converting it into a dynamic trend line. Instead of simply plotting the RSI value directly, the logic uses the RSI as a weight to influence how much the indicator follows the actual closing price of the market.
How the Logic Works
The script processes data through several key steps:
- Sensitivity Adjustment: It looks at a specific timeframe (defined by the "ARSI Period") to determine the current market strength.
- Momentum Calculation: It calculates the difference between the current RSI value and its midpoint. This tells the script how much "push" or momentum is currently in the market.
- Weighted Smoothing: This is the unique core of the script. It takes the change in the actual price and multiplies it by the momentum calculated above. If the momentum is high, the indicator reacts more aggressively to price changes; if the momentum is low, the line remains smoother and less volatile.
- Trend Tracking: The final result is a continuous line that attempts to "track" the price. By combining the actual price with its relative strength, it produces a visual representation of the underlying trend, filtering out some of the minor noise found in standard price charts.
Visual Output
The script generates a smooth, solid line (colored Dodger Blue) in a separate window below your main chart. This allows you to see the "flow" of the market momentum independently of the price bars, helping you identify the direction and strength of a trend at a glance.
//+------------------------------------------------------------------+
//| ARSI.mq4
//+------------------------------------------------------------------+
#property copyright "Alexander Kirilyuk M."
#property link ""

#property indicator_separate_window
//#property indicator_chart_window
#property indicator_buffers 1
#property indicator_color1 DodgerBlue

extern int ARSIPeriod = 14;

//---- buffers
double ARSI[];

int init()
{
	string short_name = "ARSI (" + ARSIPeriod + ")";

	SetIndexStyle(0,DRAW_LINE);
	SetIndexBuffer(0,ARSI);
	//SetIndexDrawBegin(0,ARSIPeriod);

	return(0);
}

int start()
{
	int i, counted_bars = IndicatorCounted();
	int limit;

	if(Bars <= ARSIPeriod)
		return(0);

	if(counted_bars < 0)
	{
		return;
	}

	if(counted_bars == 0)
	{
		limit = Bars;
	}
	if(counted_bars > 0)
	{
		limit = Bars - counted_bars;
	}

	double sc;
	for(i = limit; i >= 0; i--)
	{
		sc = MathAbs(iRSI(NULL, 0, ARSIPeriod, PRICE_CLOSE, i)/100.0 - 0.5) * 2.0;

		if( Bars - i <= ARSIPeriod)
			ARSI[i] = Close[i];
		else
			ARSI[i] = ARSI[i+1] + sc * (Close[i] - ARSI[i+1]);
	}

	return(0);
}
Comments