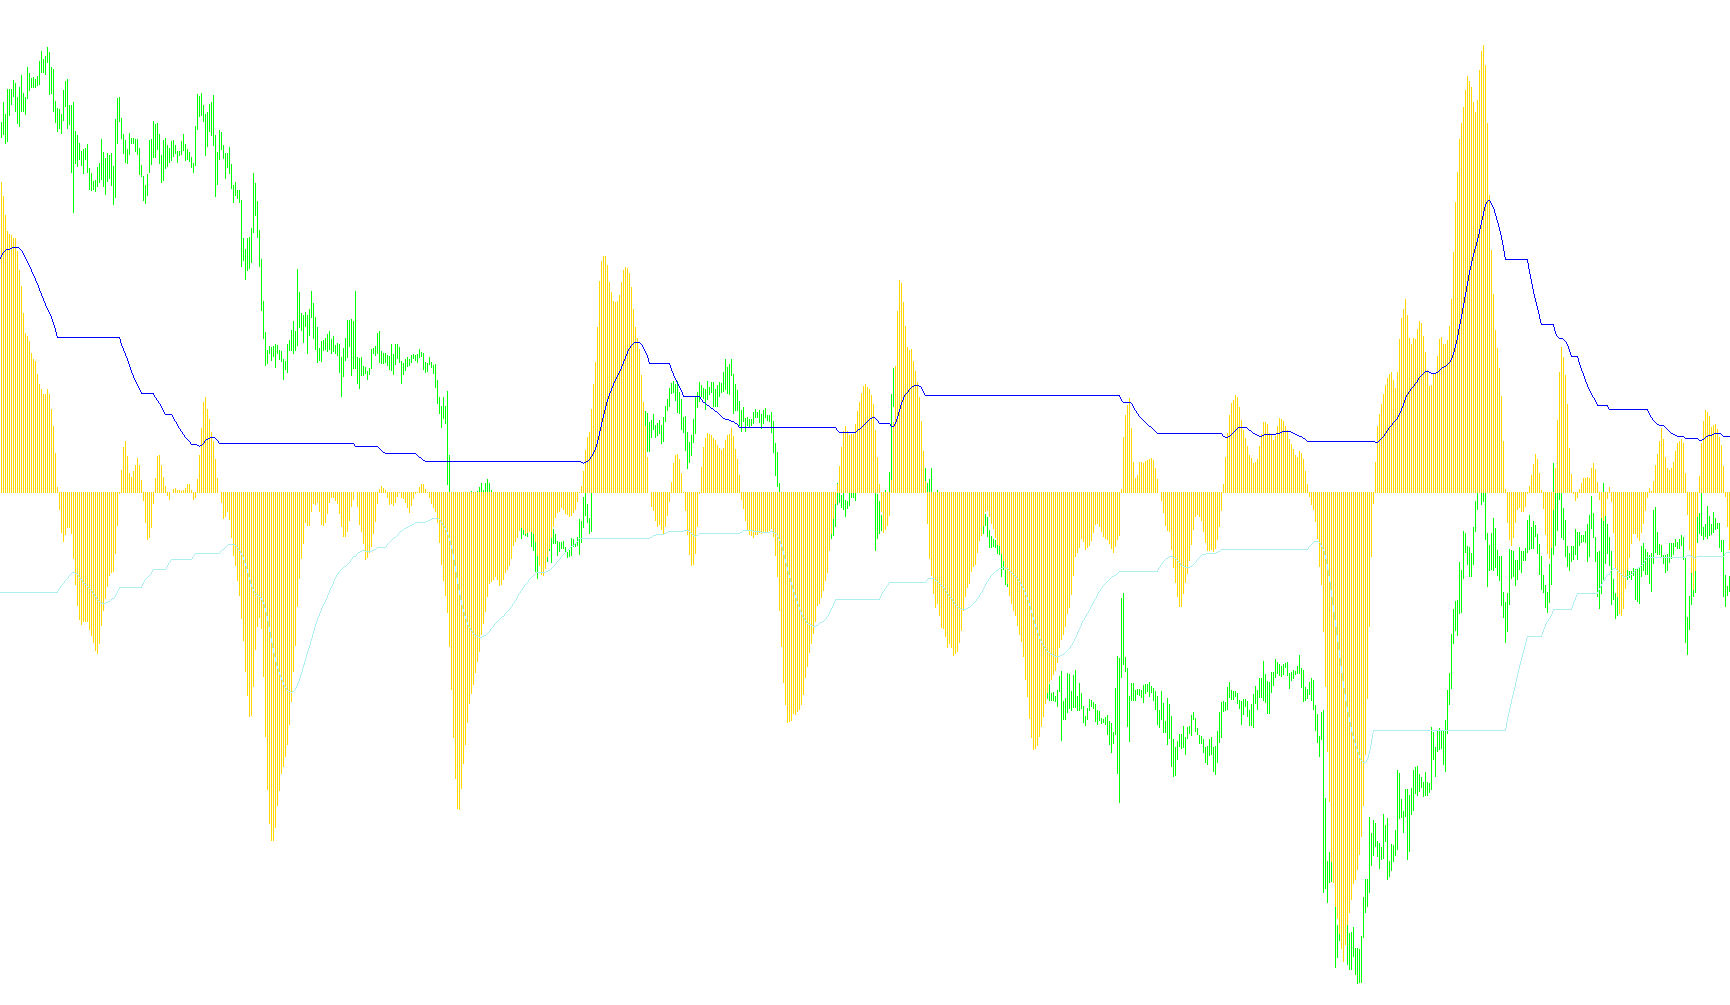
This technical script is designed to function as a specialized visual tool for market analysis. It creates a custom oscillator that helps traders visualize momentum by comparing different price averages and applying a smoothing logic to specific price movements.
Core Operational Logic
1. Data Foundation (Moving Averages) The script begins by calculating two distinct types of moving averages based on the median price of the asset:
- A short-term average (based on a 5-period window).
- A long-term average (based on a 34-period window).
2. Establishing the Baseline The tool then calculates the difference between these two averages. This creates a "gap" or a "distance" value. By subtracting the long-term average from the short-term average, the script identifies whether the current price momentum is currently leading the trend or trailing behind it.
3. Dynamic Smoothing and Trend Tracking The most sophisticated part of this script is how it handles the data it produces. Instead of just showing raw differences, it uses a mathematical "smoothing" technique to track the flow of the market:
- Positive Momentum: When the difference between the averages is positive (indicating an upward trend), the tool applies a specific weighting factor to update the primary visual line.
- Negative Momentum: When the difference becomes negative (indicating a downward trend), the script shifts its logic to weight the secondary visual line instead.
Visual Representation
To make this data easy for a user to interpret, the script outputs three different visual elements in a separate window:
- A Histogram: Represents the raw difference between the two moving averages at any given point in time.
- Primary and Secondary Lines: These lines represent the "smoothed" results of the calculations described above. They act as filters to help the user see the underlying strength and direction of a trend while filtering out minor market noise.
In essence, this tool takes complex price data, calculates the distance between different speeds of price movement, and then smooths those movements into a visual format that helps identify whether a trend is gaining strength or losing steam.
//+------------------------------------------------------------------+
//|                                      Advanced Get Oscillator.mq4 |
//|                      Copyright © 2007, MetaQuotes Software Corp. |
//|                                        http://www.metaquotes.net |
//+------------------------------------------------------------------+
#property copyright "Copyright © 2007, MetaQuotes Software Corp."
#property link      "http://www.metaquotes.net"


#property indicator_separate_window
#property indicator_buffers 3
#property indicator_color1 SlateBlue
#property indicator_color2 White
#property indicator_color3 White
//---- buffers
double ExtMapBuffer1[];
double ExtMapBuffer2[];
double ExtMapBuffer3[];
double ExtMapBuffer4[];
double ExtMapBuffer5[];

//+------------------------------------------------------------------+
//| Custom indicator initialization function |
//+------------------------------------------------------------------+
int init()
{
IndicatorBuffers(5);
//---- 3 additional buffers are used for counting.
SetIndexBuffer(3, ExtMapBuffer4);
SetIndexBuffer(4, ExtMapBuffer5);

//---- indicators
SetIndexStyle(0,DRAW_HISTOGRAM);
SetIndexBuffer(0,ExtMapBuffer1);
SetIndexStyle(1,DRAW_LINE);
SetIndexBuffer(1,ExtMapBuffer2);
SetIndexStyle(2,DRAW_LINE);
SetIndexBuffer(2,ExtMapBuffer3);
//----
return(0);
}
//+------------------------------------------------------------------+
//| Custom indicator deinitialization function |
//+------------------------------------------------------------------+
int deinit()
{
//----

//----
return(0);
}
//+------------------------------------------------------------------+
//| Custom indicator iteration function |
//+------------------------------------------------------------------+
int start()
{
int counted_bars=IndicatorCounted();
//----
//----
int limit;
//---- check for possible errors
if(counted_bars<0) return(-1);
//---- last counted bar will be recounted
if(counted_bars>0) counted_bars--;
limit=Bars-counted_bars;
//----
for(int i=0; i<limit; i++)
ExtMapBuffer4[i]=iMA(NULL,0,5,0,MODE_SMA,PRICE_MEDIAN ,i);
for(i=0; i<limit; i++)
ExtMapBuffer5[i]=iMA(NULL,0,34,0,MODE_SMA,PRICE_MEDIAN,i);
for(i=0; i<limit; i++)
ExtMapBuffer1[i]=ExtMapBuffer4[i]-ExtMapBuffer5[i];
double pr=2.0/(38+1);
int pos=Bars-2;
if (counted_bars>2) pos=Bars-counted_bars-1;
while(pos>=0)
{
if((pos==Bars-2))
{ ExtMapBuffer2[pos+1]=ExtMapBuffer1[pos+1];
ExtMapBuffer3[pos+1]=ExtMapBuffer1[pos+1];
}
if (ExtMapBuffer1[pos]>=0)
{
ExtMapBuffer2[pos]=ExtMapBuffer1[pos]*pr+ExtMapBuffer2[pos+1]*(1-pr);
ExtMapBuffer3[pos]=ExtMapBuffer3[pos+1];
}
else
{
ExtMapBuffer2[pos]=ExtMapBuffer2[pos+1];
ExtMapBuffer3[pos]=ExtMapBuffer1[pos]*pr+ExtMapBuffer3[pos+1]*(1-pr);
}
pos--;
}


//----
return(0);
}
Comments