EMA_Prediction
Download script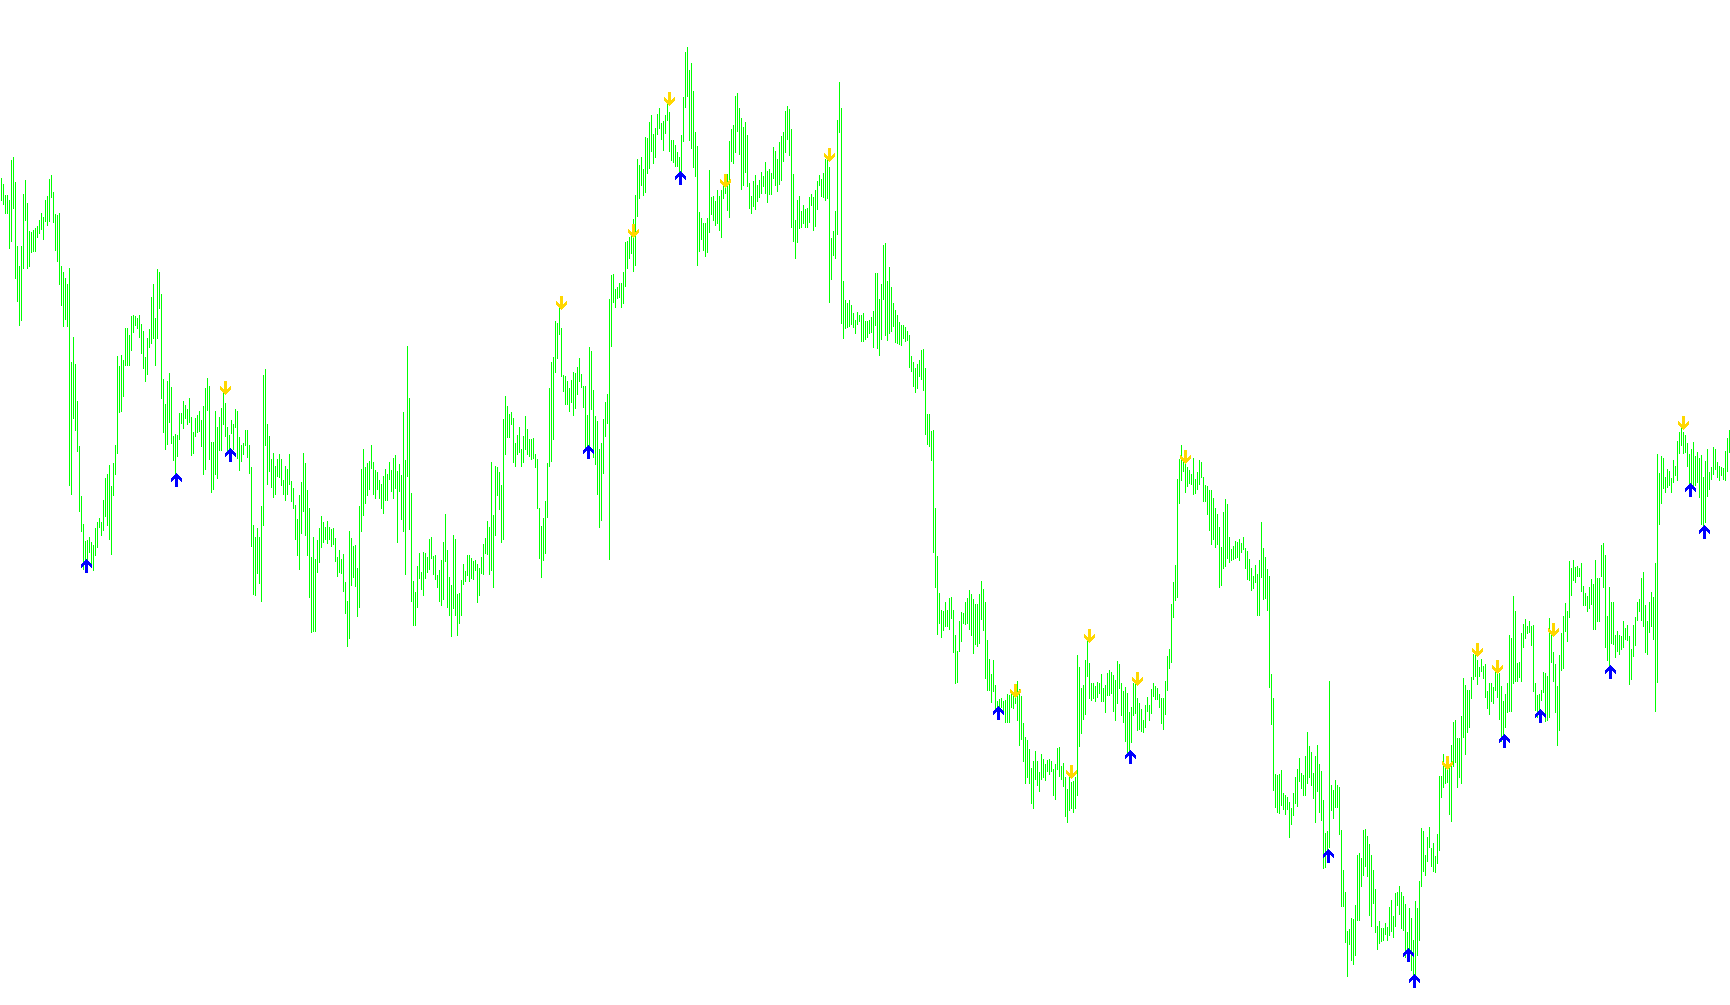
Technical Overview: EMA Prediction Indicator
This tool is designed to assist traders in identifying potential trend shifts and price movements by analyzing the relationship between two different types of moving averages. It simplifies complex market data into visual signals, helping you pinpoint moments where momentum may be changing direction.
Core Logic and Methodology
The script operates by monitoring two distinct "Exponential Moving Averages" (EMAs). These are mathematical calculations that smooth out price fluctuations to reveal the underlying trend. The tool compares a "Short-term" average against a "Long-term" average to detect crossovers—points where the faster price action intersects with the slower, broader trend.
To increase accuracy and filter out market noise, the logic incorporates two specific requirements before generating a signal:
- The Moving Average Crossover: The script looks for a moment where the Short-term EMA crosses over the Long-term EMA.
- Price Action Confirmation: Unlike simple crossover tools, this script also checks the "candle" status (the Open and Close prices) of the current period. It ensures that the price action aligns with the direction of the cross to validate the move.
How Signals Are Generated
The indicator provides visual cues on your chart based on two specific scenarios:
- Buy Indications: The script identifies a potential upward move when the Short-term average crosses above the Long-term average, provided the price action shows a specific downward "rejection" or "wick" pattern (where the opening price was higher than the closing price). When these conditions align, a visual marker appears above the price candles.
- Sell Indications: Conversely, the script identifies a potential downward move when the Short-term average crosses below the Long-term average, specifically when the price action shows an upward "rejection" (where the opening price was lower than the closing price). When this occurs, a visual marker appears below the price candles.
Visual Customization
The tool is designed to be flexible for different trading styles:
- Signal Markers: By default, the indicator places arrows/markers on the chart to highlight entry zones.
- Trend Lines: There is an optional setting that allows you to display the actual moving average lines on your chart. This helps traders visualize the "flow" of the market and see exactly how the averages are moving in real-time.
Summary for the User
Essentially, this script acts as a trend-detection filter. It waits for a specific mathematical agreement between the fast and slow moving averages, then cross-references that with the current candle's behavior to give you a "heads up" on potential price reversals. This helps take the guesswork out of identifying whether a trend is beginning to strengthen or start to fade.
//+------------------------------------------------------------------+
//|                                               EMA_Prediction.mq4 |
//|                                                       Codersguru |
//|                                         http://www.forex-tsd.com |
//+------------------------------------------------------------------+


#property copyright "Codersguru"
#property link      "http://www.forex-tsd.com"

extern int ShortEma=1;
extern int LongEma=2;
extern bool Draw_Lines = false;


#property indicator_buffers 4
#property indicator_chart_window
#property indicator_color1 Blue
#property indicator_color2 Red
#property indicator_color3 Blue
#property indicator_color4 Red

double ExtMapBuffer1[];
double ExtMapBuffer2[];
double ExtMapBuffer3[];
double ExtMapBuffer4[];

double Signal1=0,Signal2=0;
int Previous_Bar = 0;


int init()
  {

      IndicatorBuffers(4);
      SetIndexStyle(0,DRAW_ARROW);
      SetIndexStyle(1,DRAW_ARROW);
      SetIndexArrow(0, 234);
      SetIndexArrow(1, 233);
      SetIndexBuffer(0,ExtMapBuffer1);
      SetIndexBuffer(1,ExtMapBuffer2);

      SetIndexStyle(2,DRAW_LINE, STYLE_SOLID,2);
      SetIndexBuffer(2,ExtMapBuffer3);
      SetIndexStyle(3,DRAW_LINE, STYLE_SOLID,2);
      SetIndexBuffer(3,ExtMapBuffer4);

   return(0);
  }


int start()
  {


   int    counted_bars=IndicatorCounted();
//----
   int pos = Bars - counted_bars - 1;

   while (pos>=0)
   {

   Signal1=0;
	Signal2=0;
	Previous_Bar=0;

	double EmaLongPrevious = iMA(NULL,0,LongEma,0,MODE_EMA, PRICE_CLOSE, pos-1);
	double EmaLongCurrent = iMA(NULL,0,LongEma,0,MODE_EMA, PRICE_CLOSE, pos);
	double EmaShortPrevious = iMA(NULL,0,ShortEma,0,MODE_EMA, PRICE_CLOSE, pos-1);
	double EmaShortCurrent = iMA(NULL,0,ShortEma,0,MODE_EMA, PRICE_CLOSE, pos);

   if (Open[pos] > Close[pos]) Previous_Bar = 1;
   if (Open[pos] < Close[pos]) Previous_Bar = 2;

   if (EmaShortPrevious<EmaLongPrevious && EmaShortCurrent>EmaLongCurrent && Previous_Bar == 1 ) Signal1=High[pos];
   if (EmaShortPrevious>EmaLongPrevious && EmaShortCurrent<EmaLongCurrent && Previous_Bar == 2 ) Signal2=Low[pos];

   ExtMapBuffer1[pos-1]= Signal1+5*Point;
   ExtMapBuffer2[pos-1]=Signal2-5*Point;

    if(Draw_Lines)
    {
      ExtMapBuffer3[pos]= EmaLongCurrent;
      ExtMapBuffer4[pos]= EmaShortCurrent;
    }

    pos--;
   }

//----
   return(0);
}
Comments