ADX Crossing_alarm
Download script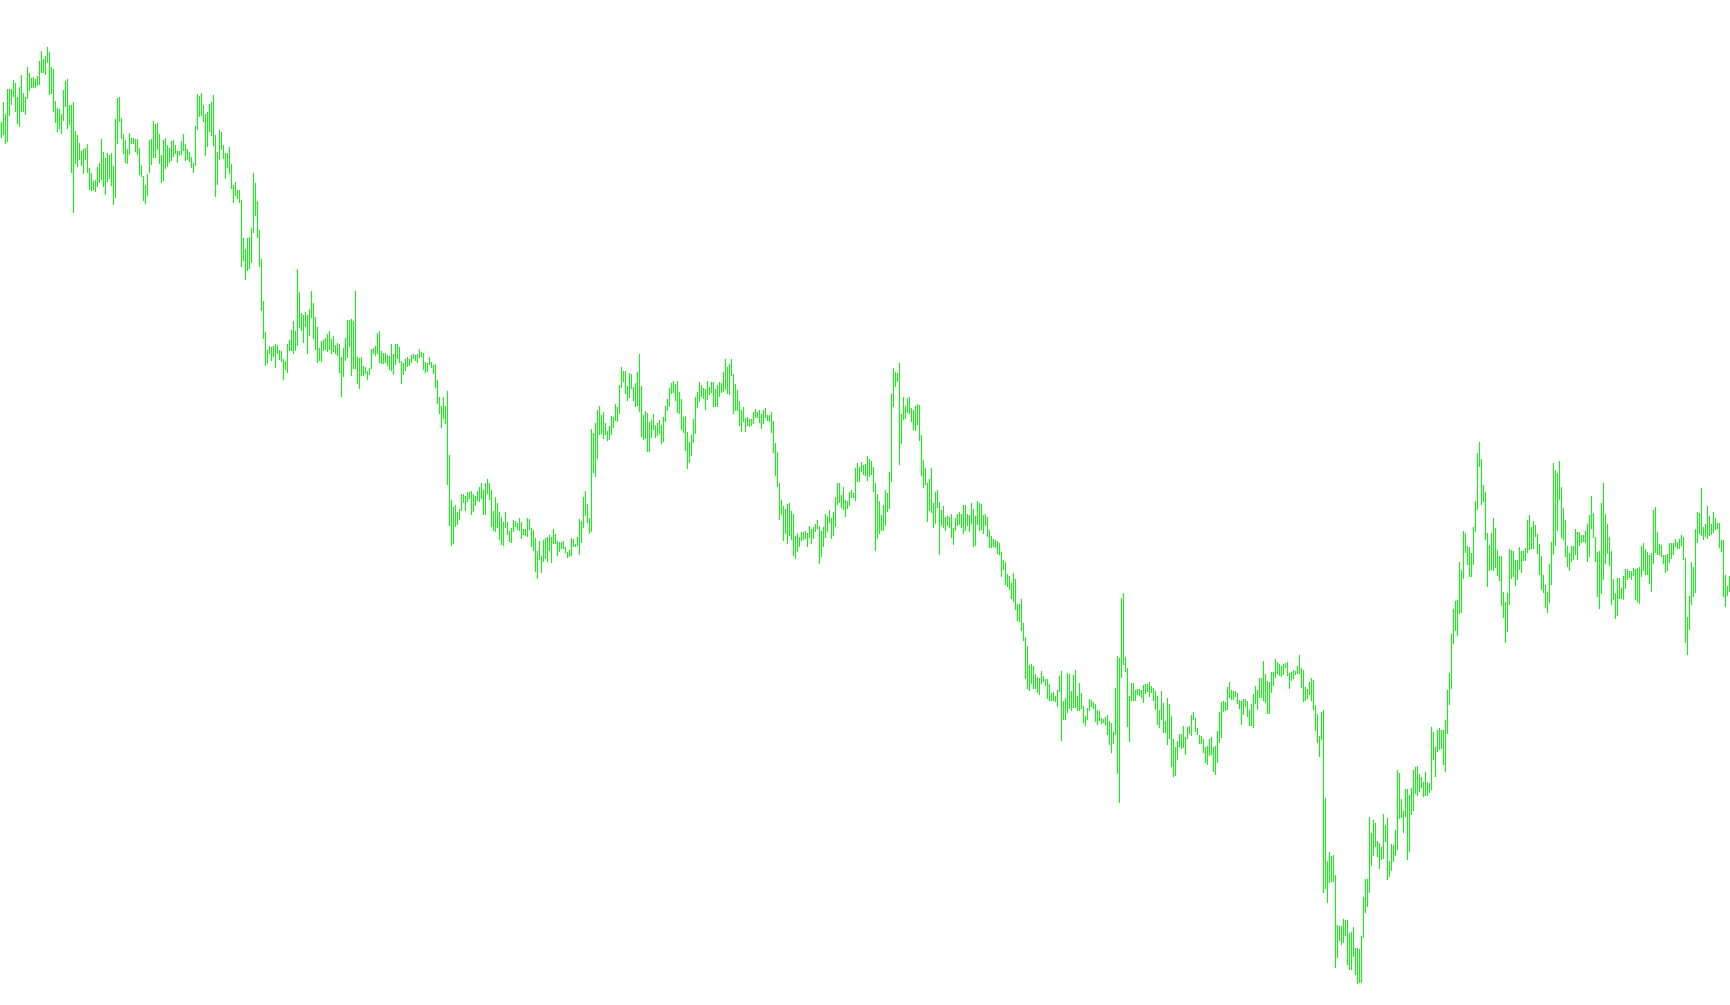
This tool is designed to act as a visual signaling system for traders who use the Average Directional Index (ADX) to determine market momentum. Rather than just showing you the trend line, this script automatically monitors price movements and alerts you specifically when there is a "crossover" between bullish and bearish forces.
How the Logic Works
The script continuously scans your trading chart to analyze two specific components of the ADX indicator: the Plus Directional Indicator (+DI) and the Minus Directional Indicator (-DI).
- The Plus DI (+DI): Represents the strength of upward (bullish) price movement.
- The Minus DI (-DI): Represents the strength of downward (bearish) price movement.
The logic identifies a "signal" at the exact moment these two lines intersect and switch positions. It looks for two specific scenarios:
- Buy Signals: The script detects when the Plus DI was previously above the Minus DI but has dropped below it. This transition signals that bearish momentum may be taking over, prompting the script to place a visual marker (an arrow) below the price candle.
- Sell Signals: Conversely, the script detects when the Plus DI was previously below the Minus DI but has climbed above it. This indicates that bullish momentum is becoming dominant, prompting the script to place a visual marker (an arrow) above the price candle.
Key Features for the User
- Visual Alerts: Instead of you having to watch the lines constantly, the script places distinct arrows on your chart to highlight exactly where the crossover occurred in the past and in real-time.
- Dynamic Notifications: Depending on your settings, the script can provide immediate feedback through audio alerts or by displaying a text comment directly on your chart screen. These comments include essential trading data such as the current Buy/Sell prices (Ask and Bid), the exact date and time of the signal, and the specific symbol and timeframe you are viewing.
- Customizable Look-back: You can define how many previous bars the script should analyze to ensure the visual markers appear consistently across your chart history.
In simple terms, this tool acts as an automated "scout." It watches the tug-of-war between buyers and sellers for you and places a flag on the map every time the lead changes hands.
//+------------------------------------------------------------------+
//| ADX Crossing.mq4
//| Amir
//+------------------------------------------------------------------+
#property  copyright "Author - Amir"

#property indicator_chart_window
#property indicator_buffers 2
#property indicator_color1 Lime
#property indicator_color2 Red

//---- input parameters
extern int ADXbars=14;
extern int CountBars=350;
extern bool UseSound = false;
extern bool TypeChart = True;
extern string NameFileSound = "alert.wav";

//---- buffers
double val1[];
double val2[];
double b4plusdi,nowplusdi,b4minusdi,nowminusdi;

//+------------------------------------------------------------------+
//| Custom indicator initialization function                         |
//+------------------------------------------------------------------+
int init()
  {
   string short_name;
//---- indicator line
   IndicatorBuffers(2);
   SetIndexStyle(0,DRAW_ARROW, EMPTY);
   SetIndexArrow(0,233);
   SetIndexStyle(1,DRAW_ARROW, EMPTY);
   SetIndexArrow(1,234);
   SetIndexBuffer(0,val1);
   SetIndexBuffer(1,val2);
//----
   return(0);
  }
//+------------------------------------------------------------------+
//| AltrTrend_Signal_v2_2                                            |
//+------------------------------------------------------------------+
int start()
  {
   if (CountBars>=Bars) CountBars=Bars;
   SetIndexDrawBegin(0,Bars-CountBars);
   SetIndexDrawBegin(1,Bars-CountBars);
   int i,shift,counted_bars=IndicatorCounted();


   //---- check for possible errors
   if(counted_bars<0) return(-1);

   //---- initial zero
   if(counted_bars<1)
     {
      for(i=1;i<=CountBars;i++) val1[CountBars-i]=0.0;
      for(i=1;i<=CountBars;i++) val2[CountBars-i]=0.0;
     }

for (shift = CountBars; shift>=0; shift--)

{
	b4plusdi=iADX(NULL,0,ADXbars,PRICE_CLOSE,MODE_PLUSDI,shift-1);
	nowplusdi=iADX(NULL,0,ADXbars,PRICE_CLOSE,MODE_PLUSDI,shift);
	b4minusdi=iADX(NULL,0,ADXbars,PRICE_CLOSE,MODE_MINUSDI,shift-1);
	nowminusdi=iADX(NULL,0,ADXbars,PRICE_CLOSE,MODE_MINUSDI,shift);
if (b4plusdi>b4minusdi && nowplusdi<nowminusdi)
{
	val1[shift]=Low[shift]-5*Point;
	if (UseSound==1) PlaySound(NameFileSound);
   if (TypeChart==1) Comment ("Buy signal at Ask=",Ask,", Bid=",Bid,", Date=",TimeToStr(CurTime(),TIME_DATE)," ",TimeHour(CurTime()),":",TimeMinute(CurTime())," Symbol=",Symbol()," Period=",Period());
}
if (b4plusdi<b4minusdi && nowplusdi>nowminusdi)
{
	val2[shift]=High[shift]+5*Point;
	if (UseSound==1) PlaySound(NameFileSound);
   if (TypeChart==1) Comment ("Sell signal at Ask=",Ask,", Bid=",Bid,", Date=",TimeToStr(CurTime(),TIME_DATE)," ",TimeHour(CurTime()),":",TimeMinute(CurTime())," Symbol=",Symbol()," Period=",Period());
  }
}
   return(0);
  }
//+------------------------------------------------------------------+
Comments