StochHistogramAlert
Download script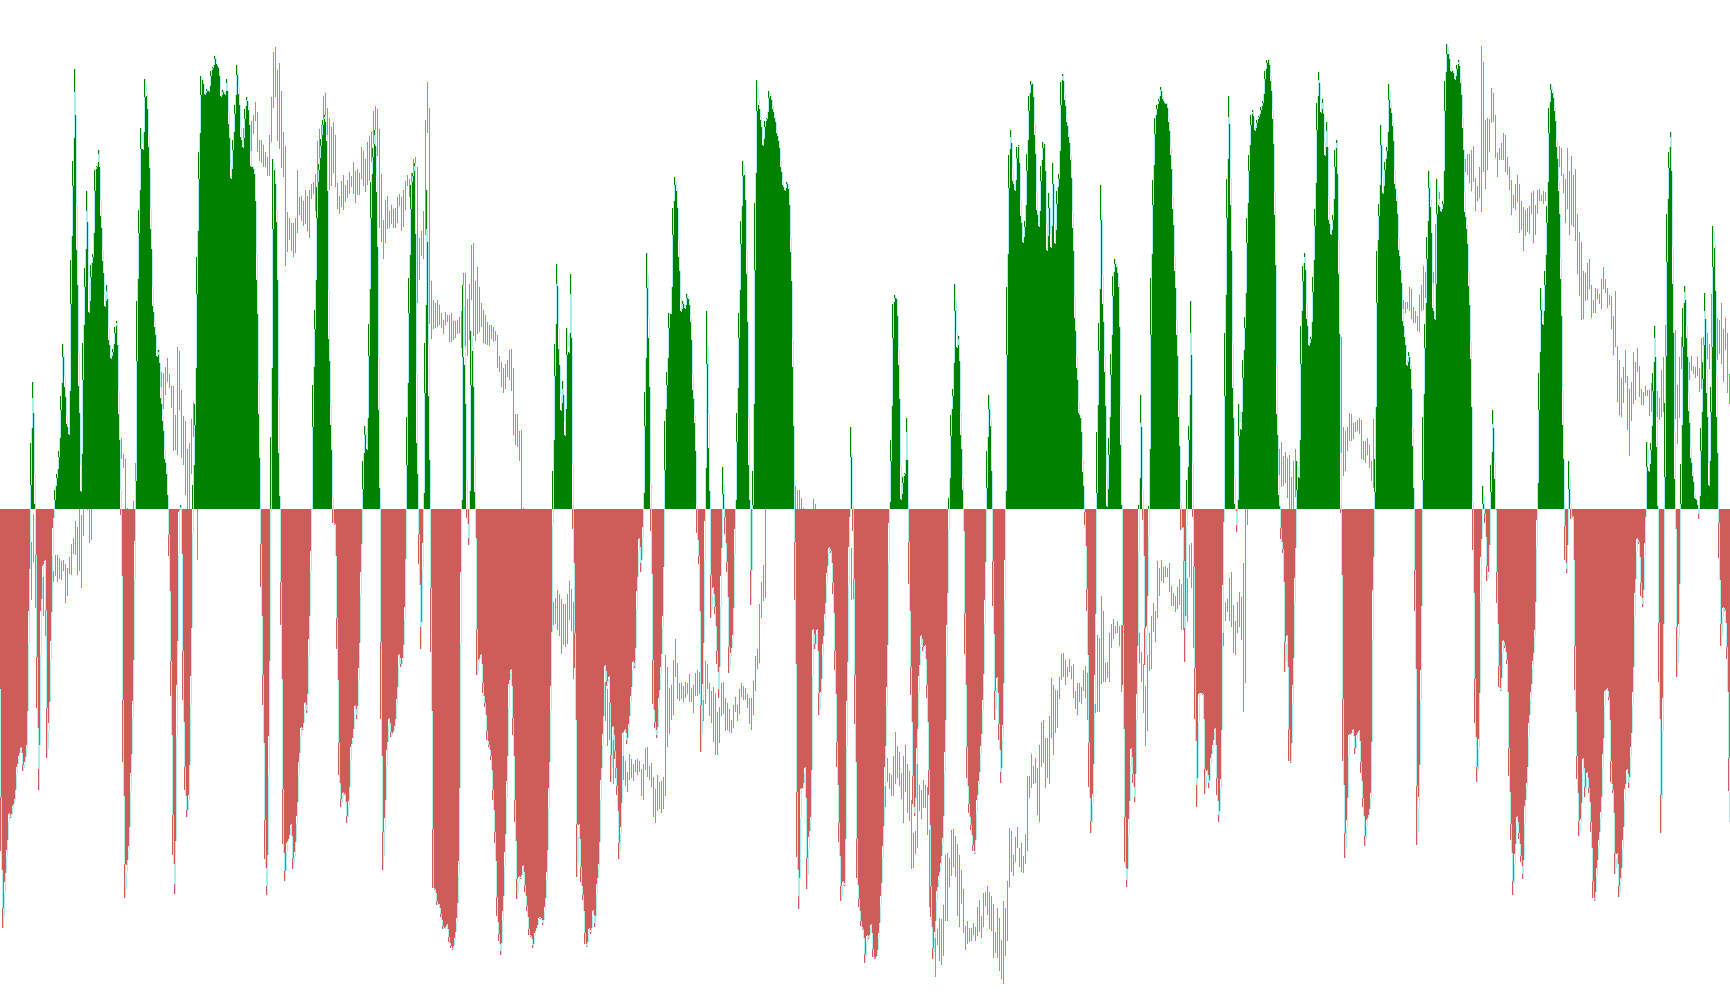
This tool is designed as a visual aid for traders to identify momentum shifts and potential entry points by monitoring price action through a specialized histogram and line graph. It simplifies the interpretation of market volatility into clear, color-coded signals.
Core Logic and Functionality
Data Processing The script utilizes a standard momentum oscillator (the Stochastic Oscillator) as its primary data source. It calculates the relationship between current price levels and previous price ranges over a specific timeframe. The key logic involves taking this raw momentum value and shifting it by a baseline of 50. This transformation allows the indicator to center around a "zero line," making it easier to distinguish between upward and downward pressure.
Visual Representation The indicator displays three distinct visual elements:
- Green Histogram: Represents positive momentum. When the data moves above the zero baseline, the green bars appear, suggesting an uptrend or bullish sentiment.
- Red Histogram: Represents negative momentum. When the data falls below the zero baseline, red bars appear, suggesting a downtrend or bearish sentiment.
- The Momentum Line: A secondary line tracks the raw movement of the indicator, providing a smoother view of how the trend is developing over time.
Signal Generation and Alerts The script includes an automated "switch" logic to identify changes in market direction:
- Buy Signals: The system detects when the momentum flips from negative to positive (crossing above the zero line). When this shift occurs, it triggers a notification.
- Sell Signals: The system detects when the momentum flips from positive to negative (crossing below the zero line). This also triggers an immediate notification.
User Experience Features
To ensure the trader is kept informed in real-time, the script includes an integrated alert system. When a significant shift in momentum is detected—specifically moving from one side of the zero line to the other—the software can provide a pop-up alert containing essential trade data:
- Current Ask and Bid prices
- The exact date and time of the signal
- The specific currency pair and timeframe being monitored
By condensing complex mathematical fluctuations into a simple color-coded histogram, this tool helps traders visualize whether the market is currently leaning toward a "Buy" or "Sell" environment.
/*
*********************************************************************

                      Bollinger Squeeze v8
                  Original code by Nick Bilak
                   Modifications by Akuma99
                   Copyright © 2006-07  Akuma99
                  http://www.beginnertrader.com

       For help on this indicator, tutorials and information
               visit http://www.beginnertrader.com

*********************************************************************
*/

#property copyright "Copyright © 2006-07, Akuma99"
#property link      "http://www.beginnertrader.com "

#property indicator_separate_window
#property indicator_buffers 3
#property indicator_color1 Green //uptrend
#property indicator_width1 2
#property indicator_color2 IndianRed  //downtrend
#property indicator_width2 2
#property indicator_color3 DarkGreen // First Stochastic line
#property indicator_width3 2


extern bool SoundON=true;
extern string note1 = "First Stochastic";
extern int    StochPeriod1=14;
extern int    DPeriod1=3;
extern int    SlowingPeriod1=3;

double upB[];
double loB[];
double Stoch1[];
int flagval1 = 0;
int flagval2 = 0;
//+------------------------------------------------------------------+
int init() {

   IndicatorBuffers(3);

   SetIndexStyle(0,DRAW_HISTOGRAM,STYLE_SOLID,indicator_width1,indicator_color1);
   SetIndexBuffer(0,upB);
   SetIndexEmptyValue(0,EMPTY_VALUE);

   SetIndexStyle(1,DRAW_HISTOGRAM,STYLE_SOLID,indicator_width2,indicator_color2); //downtrend
   SetIndexBuffer(1,loB);
   SetIndexEmptyValue(1,EMPTY_VALUE);

   SetIndexStyle(2,DRAW_LINE);
   SetIndexBuffer(2,Stoch1);
   return(0);
}
//+------------------------------------------------------------------+
int deinit() {


}
//+------------------------------------------------------------------+
int start() {

   int counted_bars=IndicatorCounted();
   int shift,limit;

   IndicatorShortName("Stoch Histogram ("+StochPeriod1+","+DPeriod1+","+SlowingPeriod1+")");
   if (counted_bars<0) return(-1);
   if (counted_bars>0) counted_bars--;

   limit=Bars-31;
   if(counted_bars>=31) limit=Bars-counted_bars-1;

   for (shift=limit;shift>=0;shift--)   {

      Stoch1[shift]=iStochastic(NULL,0,StochPeriod1,DPeriod1,SlowingPeriod1,MODE_SMA,0,MODE_MAIN,shift)-50;

      if(Stoch1[shift]>0) {

         if (flagval1==0)
         {
           flagval1=1;
           flagval2=0;
           if (shift == 1 && SoundON ) Alert("BUY signal at Ask=",Ask,"\n Bid=",Bid,"\n Time=",TimeToStr(CurTime(),TIME_DATE)," ",TimeHour(CurTime()),":",TimeMinute(CurTime()),"\n Symbol=",Symbol()," Period=",Period());
         }
         upB[shift]=Stoch1[shift];

      } else if (Stoch1[shift]<0){

         if ( flagval2==0)
         {
          flagval2=1;
          flagval1=0;
          if (shift == 1 && SoundON) Alert("SELL signal at Ask=",Ask,"\n Bid=",Bid,"\n Date=",TimeToStr(CurTime(),TIME_DATE)," ",TimeHour(CurTime()),":",TimeMinute(CurTime()),"\n Symbol=",Symbol()," Period=",Period());
         }
         loB[shift]=Stoch1[shift];

      }
   }

   return(0);

}
//+------------------------------------------------------------------+
Comments