ADXDMI_v1
Download script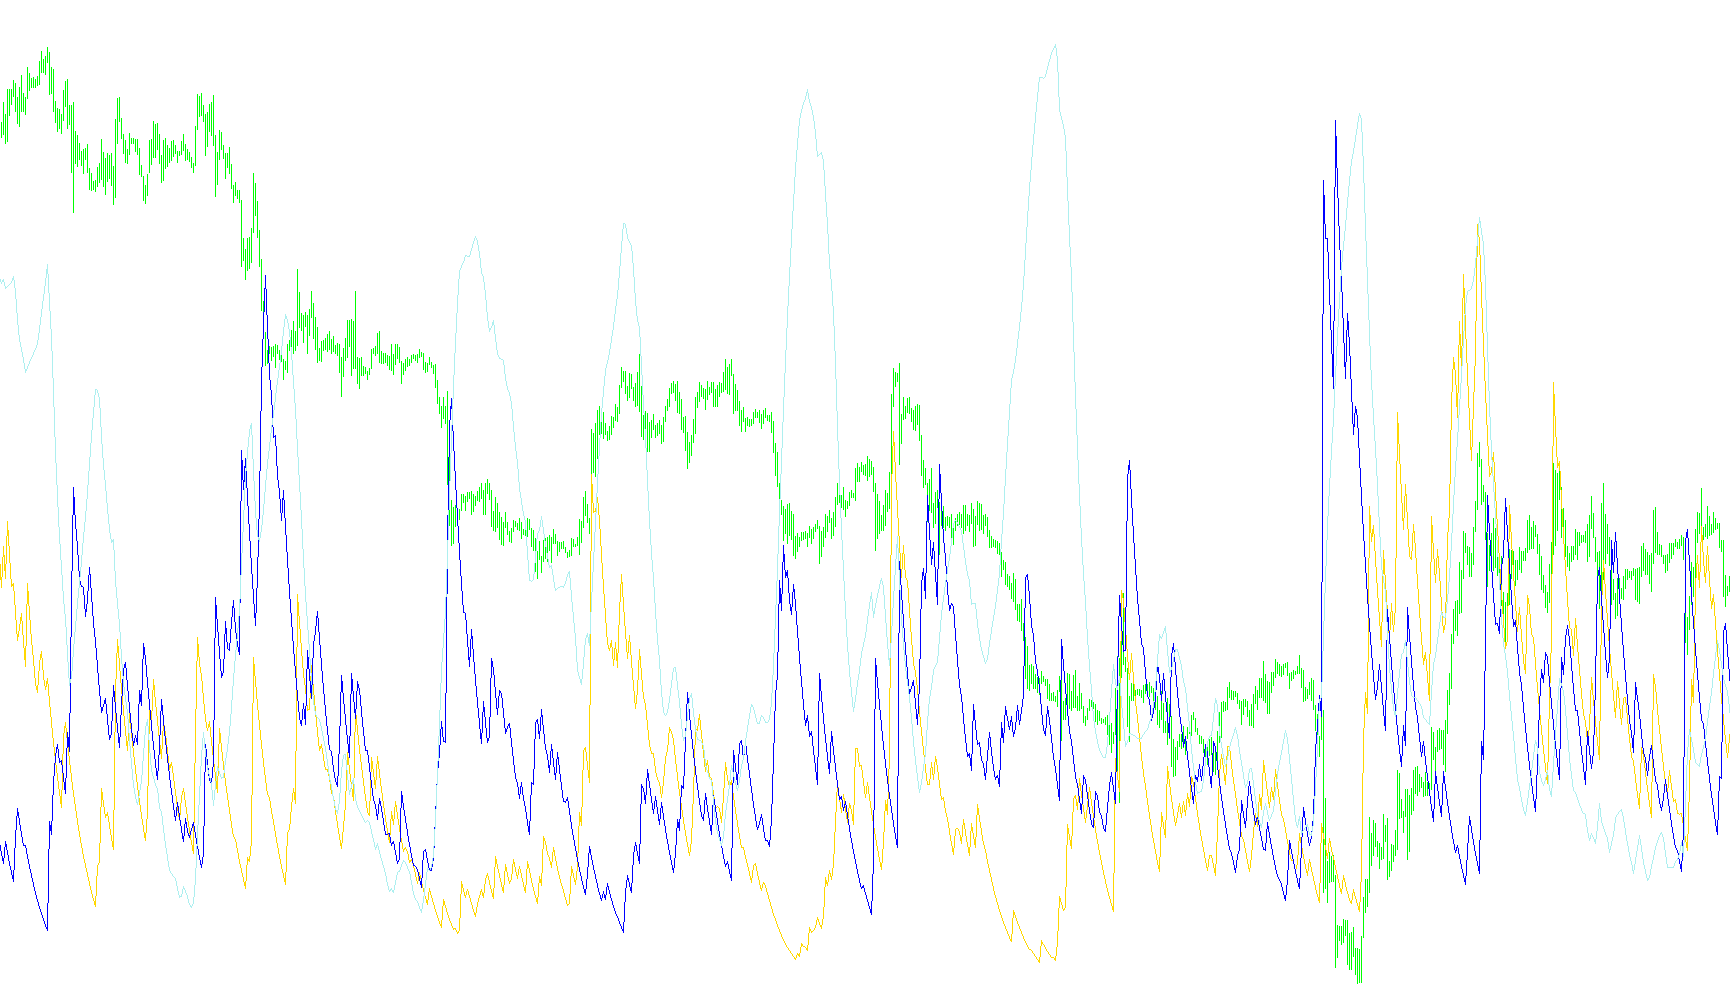
This technical indicator is designed to help traders analyze market trends by measuring the strength and direction of price movements. It operates by breaking down price action into three distinct components, providing a clearer picture of whether the market is trending strongly or moving sideways.
Core Logic and Components
The tool functions by monitoring three specific metrics simultaneously:
1. Directional Movement (Upward) The script calculates the "Positive" movement by looking at the range between consecutive price candles. It identifies instances where the high of a current candle is higher than the previous one, specifically determining if this upward move is more significant than any downward move within that same period. This helps filter out minor fluctuations to focus on genuine upward momentum.
2. Directional Movement (Downward) Similarly, the script tracks "Negative" movement by identifying instances where the low of a current candle is lower than the previous one. It prioritizes these moves only if they exceed the price gains made during the same timeframe. This allows the tool to isolate consistent downward pressure from standard market noise.
3. Trend Strength (ADX) Beyond just showing direction, the script calculates the overall strength of the trend. By comparing the difference between the upward and downward movements against their sum, it determines how aggressive the current price action is. This value helps traders distinguish between a strong, decisive trend and a weak, choppy market where prices are drifting without clear intent.
Data Processing and Visualization
To make this information actionable for a user, the script performs several background operations:
- Smoothing: It applies a mathematical smoothing process to the data. This prevents the indicator from reacting too erratically to every tiny price tick, ensuring that the lines shown on the chart represent stable trends rather than temporary spikes.
- Relative Scaling: The upward and downward movements are normalized against the "True Range" (the total volatility of the candle). By dividing the directional moves by the total volatility, the indicator provides a percentage-like perspective on how much of the market's movement is actually moving in a specific direction.
- Visual Output: The results are displayed as three distinct lines:
- Positive DI: Represents the strength of the bullish (upward) trend.
- Negative DI: Represents the strength of the bearish (downward) trend.
- ADX: Represents the overall intensity or "power" of the trend, regardless of its direction.
Summary for the Trader
In practical terms, this script allows you to see not just where the price is going, but how hard it is pushing in that direction. It helps identify when a trend is gaining momentum, when it is losing steam, or when the market is entering a period of consolidation where there is no clear dominant direction.
/*-----------------------------+
|			       |
| Shared by www.Aptrafx.com    |
|			       |
+------------------------------*/

//+------------------------------------------------------------------+
//|                                                         CADX.mq4 |
//|                      Copyright © 2005, FXTEAM                    |
//|               versiyon.1.1                                       |
//+------------------------------------------------------------------+
#property copyright "FXTEAM"
#property link      "FXTEAM Turkey"

#property indicator_separate_window
#property indicator_buffers 3

#property indicator_color1 YellowGreen
#property indicator_color2 Wheat
#property indicator_color3 White
//---- input parameters
extern int DMIPeriod=14;
extern int Smooth=10;
//---- buffers

double PlusSdiBuffer[];
double MinusSdiBuffer[];
double ADXs[];

//+------------------------------------------------------------------+
//| Custom indicator initialization function                         |
//+------------------------------------------------------------------+
int init()
  {

   IndicatorBuffers(3);
   SetIndexBuffer(0,PlusSdiBuffer);
   SetIndexBuffer(1,MinusSdiBuffer);
   SetIndexBuffer(2,ADXs);
   IndicatorShortName("FXDI("+DMIPeriod+")");

   SetIndexLabel(0,"+DI");
   SetIndexLabel(1,"-DI");
   SetIndexLabel(2,"ADX");

   SetIndexDrawBegin(0,DMIPeriod);
   SetIndexDrawBegin(1,DMIPeriod);
   SetIndexDrawBegin(2,DMIPeriod);

//----
   return(0);
  }
//+------------------------------------------------------------------+
//| Average Directional Movement Index                               |
//+------------------------------------------------------------------+
int start()
  {
   double pdm,mdm,tr,xx,yy,ss,mm;
   double price_high,price_low;
   double sabit,toplam,MA,PREP,PREN,PRETR;
   double PD;
   double ND,Buff;
   double ADX,PREADX;
   int    starti,i,j,n,counted_bars=IndicatorCounted();
//----
   if(Bars<=DMIPeriod) return(0);
//---- initial zero
      for(i=0;i<=Bars-2;i++)
      {
      PlusSdiBuffer[i]=0.0;
      MinusSdiBuffer[i]=0.0;
      ADXs[i]=0.0;
      }

   i=Bars;


//----
   PREP=0.0;
   PREN=0.0;
   PRETR=0.0;
   ADX=0.0;
   PREADX=0.0;
   i=Bars-2;


   while(i>=0)
     {

      if(High[i]>High[i+1] && (High[i]-High[i+1])>(Low[i+1]-Low[i]))
      {

      xx=High[i]-High[i+1];
      }
      else
      {
      xx=0.0;

      }

      PD=(((DMIPeriod-1.0)*PREP)+xx)/(DMIPeriod);

      if(Low[i]<Low[i+1] && (Low[i+1]-Low[i])>(High[i]-High[i+1]))
      {
      xx=Low[i+1]-Low[i];
      }
      else
      {
      xx=0.0;}

      ND=(((DMIPeriod-1.0)*PREN)+xx)/(DMIPeriod);

      //***
      Buff = MathAbs(PD-ND);
      if (Buff == 0) {
         ADX=(((Smooth-1.0)*PREADX))/Smooth;
      }
      else{
      ADX=(((Smooth-1.0)*PREADX)+  (MathAbs(PD-ND)/(PD+ND)))/Smooth;}

      //**
      PREN=ND;
      PREP=PD;
      PREADX=ADX;

      double num1=MathAbs(price_high-price_low);
      double num2=MathAbs(price_high-Close[i+1]);
      double num3=MathAbs(Close[i+1]-price_low);

      tr=MathMax(num1,num2);
      tr=MathMax(tr,num3);


      tr=(((DMIPeriod-1.0)*PRETR)+tr)/DMIPeriod;
      PRETR=tr;
      PlusSdiBuffer[i]=100000*(PD/tr);
      MinusSdiBuffer[i]=100000*(ND/tr);
      ADXs[i]=100*ADX;

      i--;
     }


      return(0);
  }
//+------------------------------------------------------------------+
Comments