ADXDMI_v2
Download script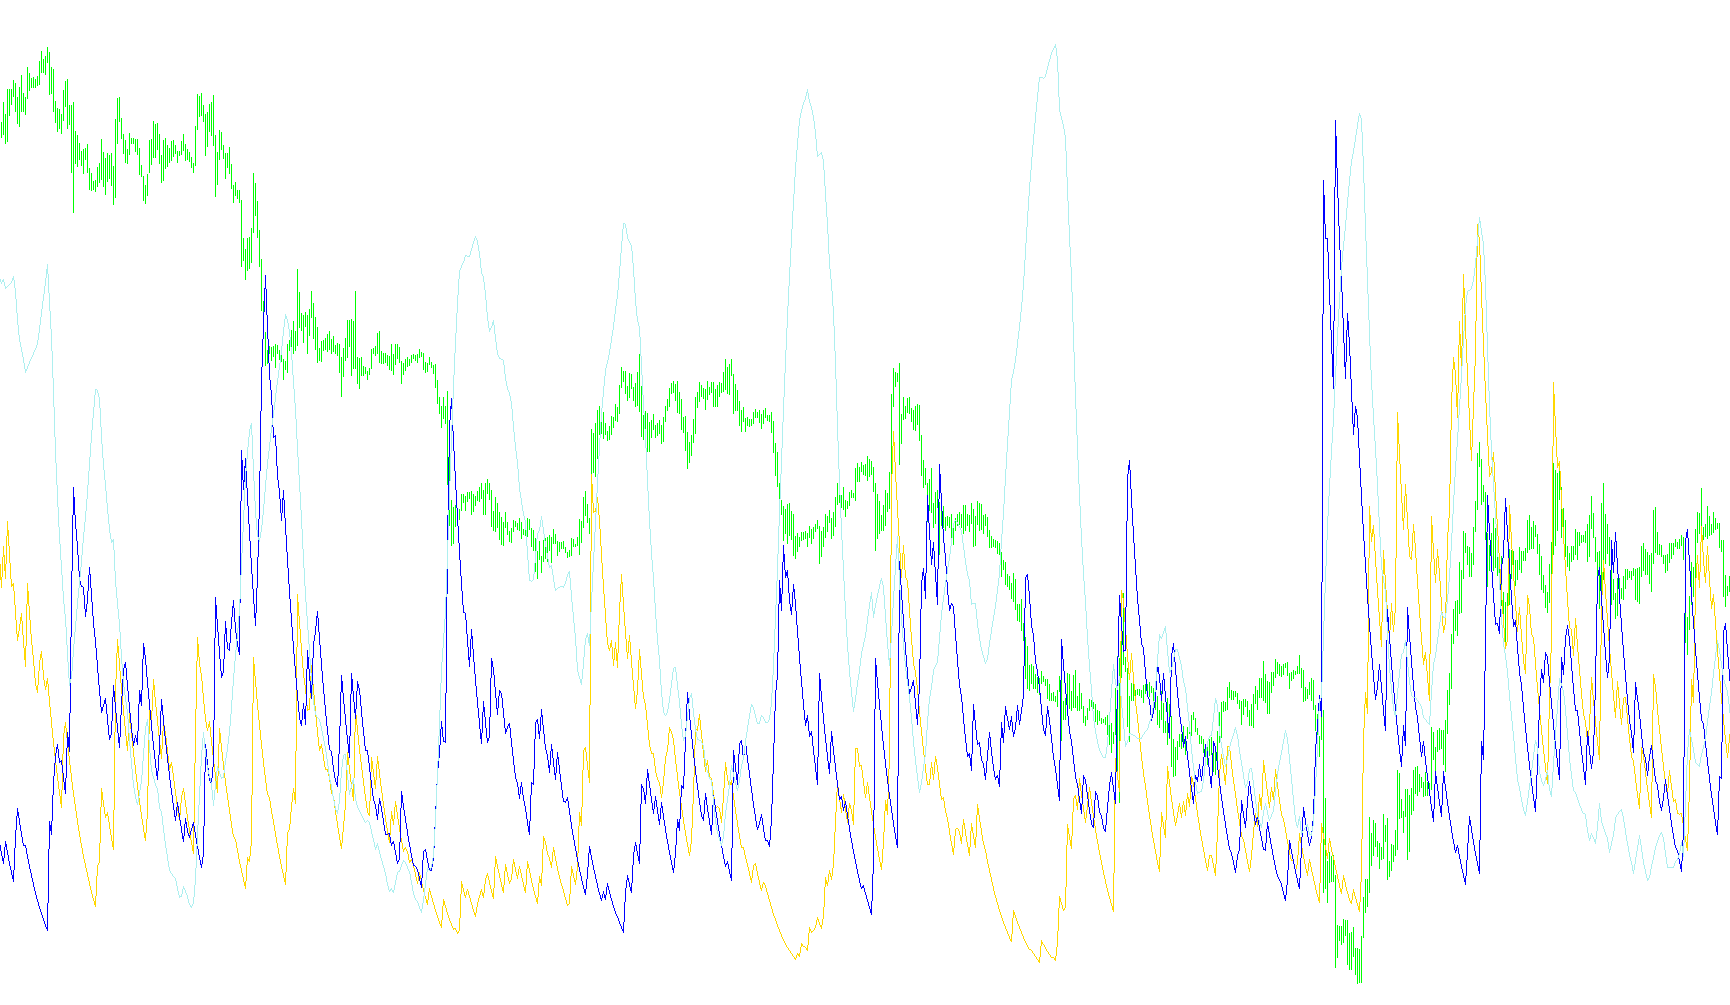
This script is a custom technical analysis tool designed for the MetaTrader platform to help traders identify the strength and direction of market trends. It operates by calculating three distinct values simultaneously, providing a comprehensive view of whether a currency or asset is moving with momentum or simply fluctuating randomly.
Core Logic Overview
The tool functions by analyzing price movements over a specific period (defaulting to 14 bars) and applying a smoothing factor to filter out "noise" from the market. It looks at the highs, lows, and closing prices of candles to determine the following three components:
1. Upward Movement (+DI) The script monitors how aggressively the price is pushing toward new highs. If the upward movement exceeds the downward movement, it calculates a positive momentum value. This helps traders see if "buyers" are in control of the current price action.
2. Downward Movement (-DI) Similarly, the script tracks how significantly the price drops toward new lows. If the downward pressure is greater than the upward push, it records a negative momentum value. This serves as an indicator of "seller" dominance.
3. Trend Strength (ADX) This is perhaps the most critical part of the logic. The script compares the difference between the upward and downward movements to calculate the overall trend strength.
- If the price is moving strongly in one direction (either up or down), the ADX value will rise, signaling a healthy, established trend.
- If the price is moving sideways or fluctuating without clear direction, the ADX value remains low, suggesting a "choppy" market where trend-following strategies might be less effective.
How it Visualizes Data
The script produces three distinct lines on a separate window below your main price chart:
- Positive Movement: Represents the intensity of the upward trend.
- Negative Movement: Represents the intensity of the downward trend.
- Trend Strength Index: A third line that tells you how "powerful" the current movement is, regardless of whether it is going up or down.
Practical Application
By observing these three lines together, a user can quickly determine market conditions:
- Bullish Trend: When the upward line is significantly above the downward line and the trend strength index is climbing.
- Bearish Trend: When the downward line is significantly above the upward line and the trend strength index is climbing.
- Sideways/Ranging Market: When both the upward and downward lines are intertwined and the trend strength index remains flat or low.
//+------------------------------------------------------------------+
//|                                                         CADX.mq4 |
//|                      Copyright © 2005, FXTEAM                    |
//|               versiyon.1.1                                       |
//+------------------------------------------------------------------+
#property copyright "FXTEAM"
#property link      "FXTEAM Turkey"
#property indicator_separate_window
#property indicator_buffers 3
#property indicator_color1 YellowGreen
#property indicator_color2 Wheat
#property indicator_color3 White
//---- input parameters
extern int DMIPeriod=14;
extern int Smooth=10;
//---- buffers
double PlusSdiBuffer[];
double MinusSdiBuffer[];
double ADXs[];
//+------------------------------------------------------------------+
//| Custom indicator initialization function                         |
//+------------------------------------------------------------------+
int init()
  {
   IndicatorBuffers(3);
   SetIndexBuffer(0,PlusSdiBuffer);
   SetIndexBuffer(1,MinusSdiBuffer);
   SetIndexBuffer(2,ADXs);
   IndicatorShortName("FXDI("+DMIPeriod+")");
//----
   SetIndexLabel(0,"+DI");
   SetIndexLabel(1,"-DI");
   SetIndexLabel(2,"ADX");
//----
   SetIndexDrawBegin(0,DMIPeriod);
   SetIndexDrawBegin(1,DMIPeriod);
   SetIndexDrawBegin(2,DMIPeriod);
//----
   return(0);
  }
//+------------------------------------------------------------------+
//| Average Directional Movement Index                               |
//+------------------------------------------------------------------+
int start()
  {
   double pdm,mdm,tr,xx,yy,ss,mm;
   double price_high,price_low;
   double sabit,toplam,MA,PREP,PREN,PRETR;
   double PD;
   double ND,Buff;
   double ADX,PREADX;
   int    starti,i,j,n,counted_bars=IndicatorCounted();
//----
   if(Bars<=DMIPeriod) return(0);
//---- initial zero
   for(i=0;i<=Bars-2;i++)
     {
      PlusSdiBuffer[i]=0.0;
      MinusSdiBuffer[i]=0.0;
      ADXs[i]=0.0;
     }
   i=Bars;
//----
   PREP=0.0;
   PREN=0.0;
   PRETR=0.0;
   ADX=0.0;
   PREADX=0.0;
   i=Bars-2;
//----
   while(i>=0)
     {
      if(High[i]>High[i+1] && (High[i]-High[i+1])>(Low[i+1]-Low[i]))
        {
         xx=High[i]-High[i+1];
        }
      else
        {
         xx=0.0;
        }
      PD=(((DMIPeriod-1.0)*PREP)+xx)/(DMIPeriod);
//----
      if(Low[i]<Low[i+1] && (Low[i+1]-Low[i])>(High[i]-High[i+1]))
        {
         xx=Low[i+1]-Low[i];
        }
      else
        {
        xx=0.0;}
      ND=(((DMIPeriod-1.0)*PREN)+xx)/(DMIPeriod);
      //***
      Buff=MathAbs(PD-ND);
        if (Buff==0)
        {
         ADX=(((Smooth-1.0)*PREADX))/Smooth;
        }
        else{
        ADX=(((Smooth-1.0)*PREADX)+  (MathAbs(PD-ND)/(PD+ND)))/Smooth;}
      //**
      PREN=ND;
      PREP=PD;
      PREADX=ADX;
//----
      double num1=MathAbs(price_high-price_low);
      double num2=MathAbs(price_high-Close[i+1]);
      double num3=MathAbs(Close[i+1]-price_low);
//----
      tr=MathMax(num1,num2);
      tr=MathMax(tr,num3);
//----
      tr=(((DMIPeriod-1.0)*PRETR)+tr)/DMIPeriod;
      PRETR=tr;
      PlusSdiBuffer[i]=100000*(PD/tr);
      MinusSdiBuffer[i]=100000*(ND/tr);
      ADXs[i]=100*ADX;
      i--;
     }
   return(0);
  }
//+------------------------------------------------------------------+
Comments