Donchian Channels - Generalized version1
Download script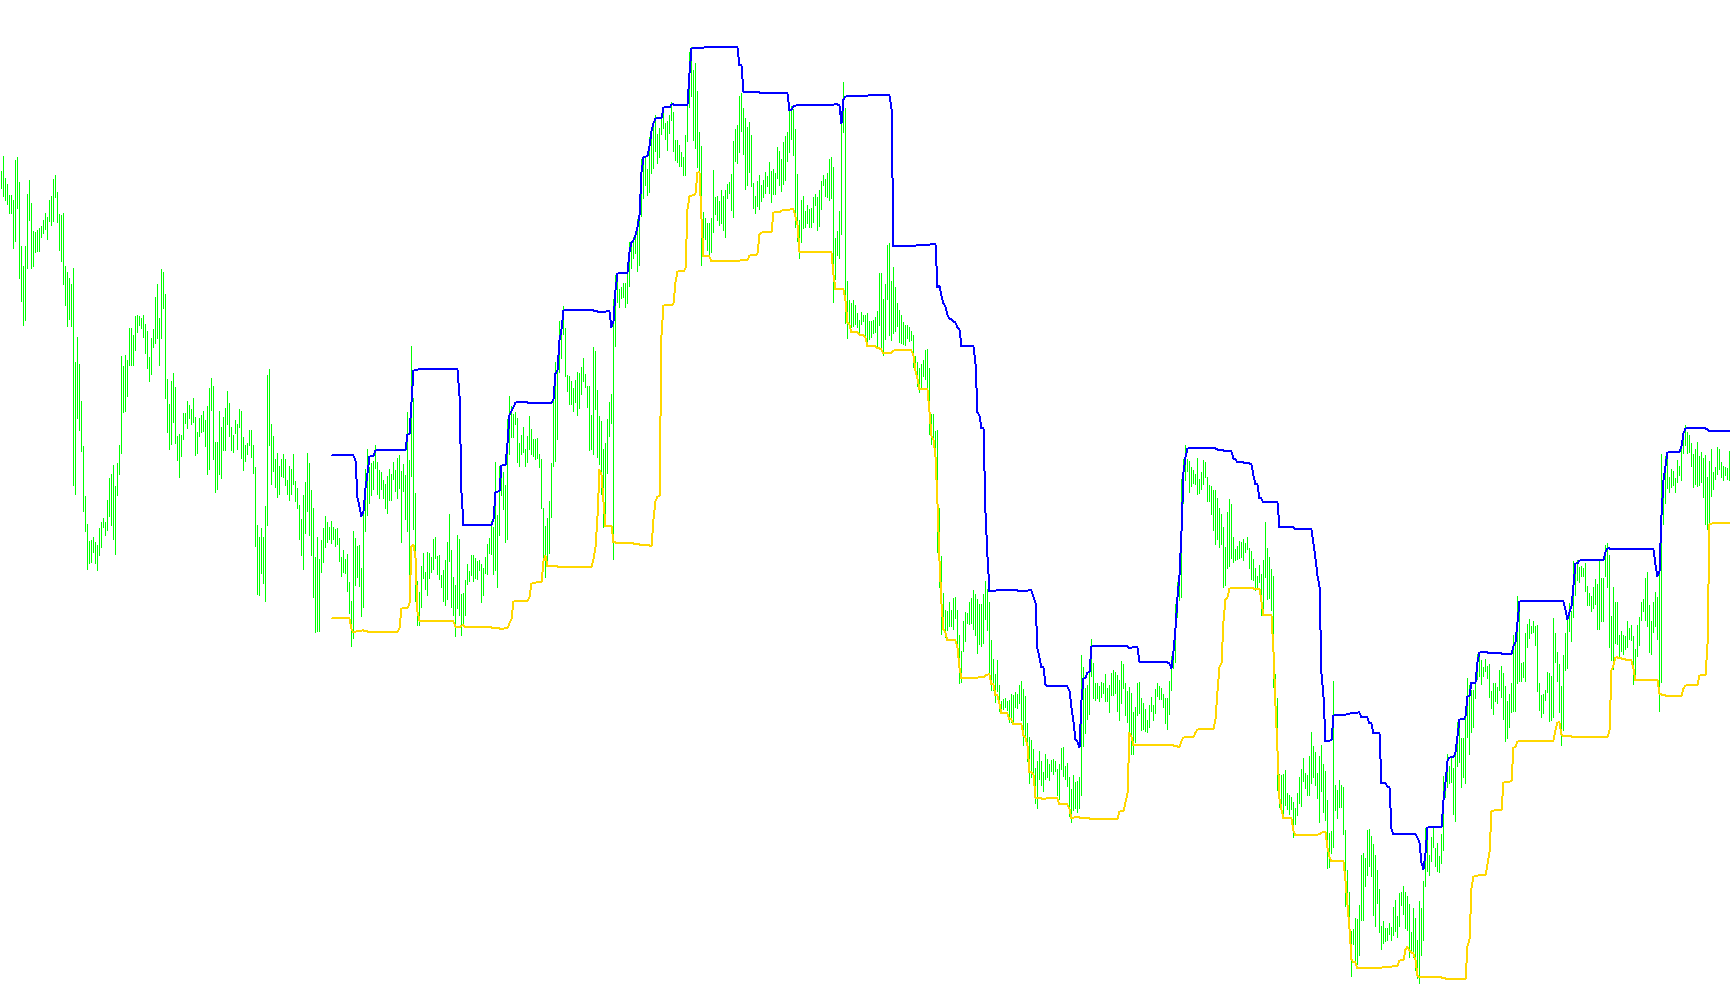
This technical indicator is designed to identify and visualize price boundaries by analyzing historical price movements over a specific timeframe. It functions by creating a "channel" that encapsulates the market's recent volatility, helping traders visualize where price highs and lows have occurred in the past.
Core Logic and Functionality
Price Range Identification The tool scans a set number of previous candles (the "Period") to determine the highest and lowest points reached by the market. Instead of simply looking at the absolute peak or valley, the script offers different mathematical methods to define these boundaries based on user preference:
- It can identify the exact maximum high and minimum low.
- It can calculate the starting price (the "Open") of those specific bars.
- It can calculate the median point between the opening and closing extremes.
Dynamic Channel Construction Once the highs and lows are identified, the tool constructs a channel. This is not just a static box; it uses a percentage-based "Margin" to adjust the width of the lines. By adding or subtracting a specific percentage from the boundaries, the tool can expand or contract the visual space, allowing for a more tailored view of price action.
Visual Representation and Forecasting The script renders these calculations as two distinct lines on the chart:
- An upper boundary representing the ceiling of the price action.
- A lower boundary representing the floor of the price action.
Additionally, the logic includes an "Advance" feature. This allows the indicator to project these calculated boundaries slightly forward into the future, providing a visual sense of where the immediate price limits might reside based on the most recent historical data.
Summary for the User
In essence, this tool acts as a dynamic map of market extremes. It automatically tracks how high and low the price has traveled over a specific window of time, drawing "guardrails" on your chart. These rails help you see the boundaries of current market behavior, making it easier to identify potential support and resistance levels or to observe when the market is expanding or contracting in its volatility.
/*-----------------------------+
|			       |
| Shared by www.Aptrafx.com    |
|			       |
+------------------------------*/

//+------------------------------------------------------------------+
//|                      Donchian Channels - Generalized version.mq4 |
//|                         Copyright © 2005, Luis Guilherme Damiani |
//|                                      http://www.damianifx.com.br |
//+------------------------------------------------------------------+
#property copyright "Copyright © 2005, Luis Guilherme Damiani"
#property link      "http://www.damianifx.com.br"

#property indicator_chart_window
#property indicator_buffers 2
#property indicator_color1 Magenta
#property indicator_color2 SteelBlue

//Periods: number of bars used for calculating the Donchian channel
//Extremes: if 1 uses the highest high and the lowest low -> I do not recomend using this
//			if 0 uses the open of the extremes bar -> the open point of a bar (as well as the close
//				are the points of maximum probability of concentration of the prices during the bar
//			if 3 uses the median point most extreme open and lowest low or highest high
//Margins: is the percent of the channel subtrated from the channel border before printing it, negative values are allowed
//Advance: the numbers of bars ahead
//---- input parameters
extern int       Periods=24;
extern int       Extremes=3;
extern int       Margins=-2;
extern int       Advance=0;
extern int       max_bars=700;
//---- buffers
double ExtMapBuffer1[];
double ExtMapBuffer2[];
//+------------------------------------------------------------------+
//| Custom indicator initialization function                         |
//+------------------------------------------------------------------+
int init()
  {
//---- indicators
   SetIndexStyle(0,DRAW_LINE,1,2);
   SetIndexBuffer(0,ExtMapBuffer1);
   SetIndexStyle(1,DRAW_LINE,1,2);
   SetIndexBuffer(1,ExtMapBuffer2);

   IndicatorShortName("DoC("+Periods+")");

//----
   return(0);
  }
//+------------------------------------------------------------------+
//| Custor indicator deinitialization function                       |
//+------------------------------------------------------------------+
int deinit()
  {
//----

//----
   return(0);
  }
//+------------------------------------------------------------------+
//| Custom indicator iteration function                              |
//+------------------------------------------------------------------+
int start()
{
   int    fixed_bars=IndicatorCounted();
   //----

   //int shift=0;//, cnt(0), loopbegin(0);
   double smin=0, smax=0, SsMax=0, SsMin=0;
   //Variables : bar(0), prevbars(0), start(0), cs(0), prevcs(0),commodt(0);

   if(max_bars == 0) max_bars = Bars;

   for (int shift=0;shift< max_bars;shift++)
   {
	  if (Extremes ==1)
	  {
		 SsMax = High[Highest(NULL,0,MODE_HIGH,Periods,shift)];
		 SsMin = Low[Lowest(NULL,0,MODE_LOW,Periods,shift)];
	  }
	  else if (Extremes == 3)
	  {
		 SsMax = (Open[Highest(NULL,0,MODE_OPEN,Periods,shift)]+High[Highest(NULL,0,MODE_HIGH,Periods,shift)])/2;
		 SsMin = (Open[Lowest(NULL,0,MODE_OPEN,Periods,shift)]+Low[Lowest(NULL,0,MODE_LOW,Periods,shift)])/2;
	  }
	     else
	  {
		SsMax = Open[Highest(NULL,0,MODE_OPEN,Periods,shift)];
		SsMin = Open[Lowest(NULL,0,MODE_OPEN,Periods,shift)];
	  }
	  smin = SsMin+(SsMax-SsMin)*Margins/100;
	  smax = SsMax-(SsMax-SsMin)*Margins/100;
	  ExtMapBuffer1[shift-Advance]=smin;
	  ExtMapBuffer2[shift-Advance]=smax;
   }
//----
   return(0);
  }
//+------------------------------------------------------------------+
Comments