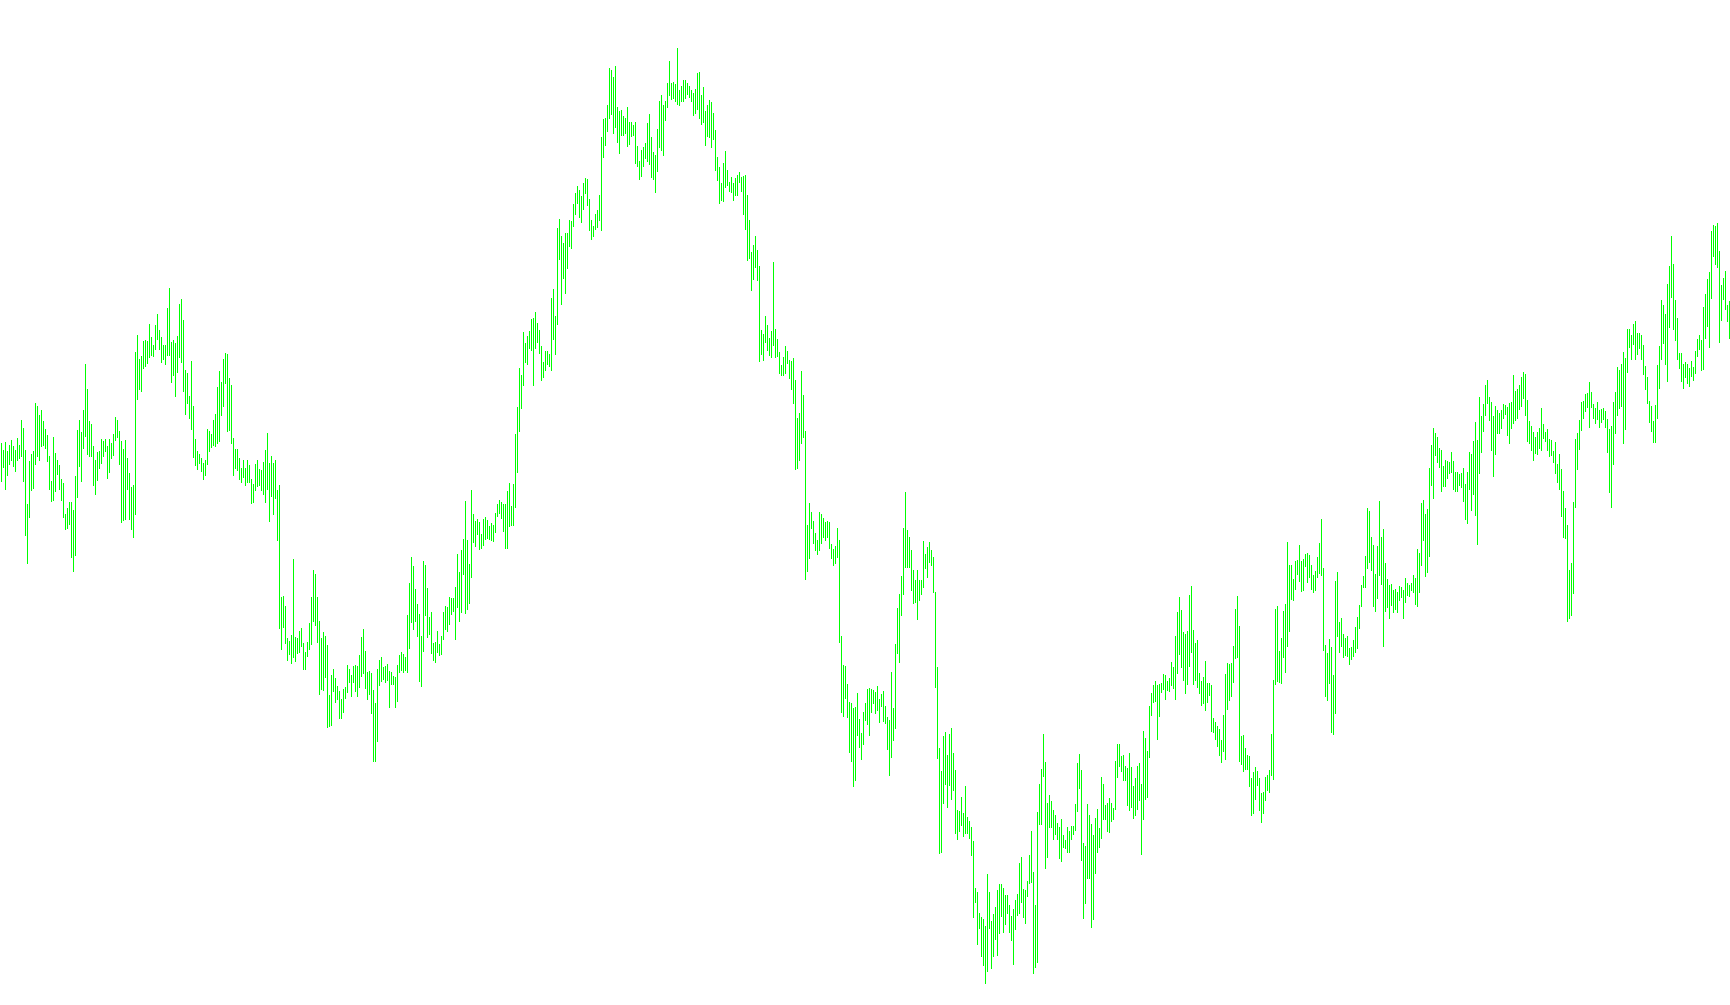
This script is a specialized technical analysis tool designed to help traders identify market trends and potential entry points by analyzing the relationship between price action, volatility, and momentum. It operates by processing historical price data to determine whether the market is behaving in an "aggressive" or "stable" manner.
Core Logic Overview
The indicator functions through a multi-step calculation process that filters out market noise to highlight specific directional movements:
1. Market State Detection The tool first evaluates the current price relative to its historical averages. It looks at high and low price points over a specific period (defined by the "Lookback" setting). By comparing these prices to moving averages, the script categorizes the market into two distinct states:
- Upward Pressure: When the price exceeds expected high-point averages.
- Downward Pressure: When the price falls below expected low-point averages.
2. Volatility and Price Integration Once the general direction is identified, the script calculates a "value" for each data point. It does this by combining moving averages with the Average True Range (ATR)—a standard measure of market volatility.
- In a downward state, it subtracts volatility from the high price average.
- In an upward state, it adds volatility to the low price average. This step ensures that the tool isn't just looking at where the price is, but also how much "room" or "energy" the price has moved with.
3. Momentum Smoothing (RSI Processing) To prevent the data from appearing too erratic or jagged on the chart, the script takes the values calculated in the previous step and runs them through a Relative Strength Index (RSI) calculation. This smooths out the fluctuations and provides a cleaner representation of the market's momentum.
4. Visual Output Finally, the script translates these complex calculations into visual signals on your chart:
- Upward Signals: When the logic confirms strong upward momentum, it plots a specific line (Lime) in the indicator window.
- Downward Signals: When the logic confirms strong downward momentum, it plots a corresponding line (Red) in the indicator window.
- When the market is neutral or doesn't meet the specific criteria for a trend, these lines remain hidden, allowing the trader to focus only on clear directional shifts.
Summary for the User
Essentially, this tool acts as a filter. It looks at price highs and lows, measures how volatile those movements are, and then uses a smoothing formula to tell you when the market is convincingly moving in one direction versus another. Instead of showing you every tiny price wiggle, it aims to highlight the sustained "flow" of the market.
//+------------------------------------------------------------------+
//| Ahoora.mq4.mq4
//| Copyright © 2010, Farshad Saremifar, Farshad.saremifar@gmail.com
//| Farshad.saremifar@gmail.com
//+------------------------------------------------------------------+
#property copyright "Copyright © 2010, Farshad Saremifar, Farshad.saremifar@gmail.com"
#property link      "Farshad.saremifar@gmail.com"

#property indicator_separate_window
#property indicator_minimum 0
#property indicator_maximum 100

#property indicator_buffers 3
#property indicator_color1 Lime
#property indicator_color2 Red
#property indicator_color3 Khaki

#property indicator_width1 3
#property indicator_width2 3
#property indicator_width3 1

#property indicator_style3 STYLE_DASHDOTDOT
#property indicator_level1 10
#property indicator_level2 20
#property indicator_level3 30
#property indicator_level4 50
#property indicator_level5 70
#property indicator_level6 80
#property indicator_level7 90
extern string Copyright="Version 1.1 :Farshad Saremifar";
extern int Lookback = 25;
extern int ma_method=1;
 bool FillHole=true;
double up[];
double down[];
double Up[];
double buffer[];
double value[];
double value2[];
double value3[];
//+------------------------------------------------------------------+
//| Custom indicator initialization function                         |
//+------------------------------------------------------------------+
int init()
  {
//---- indicators
IndicatorBuffers(5);
SetIndexBuffer(0, up);
SetIndexStyle(0, DRAW_LINE);
SetIndexBuffer(1, down);
SetIndexStyle(1, DRAW_LINE);
SetIndexBuffer(2, value2);
SetIndexStyle(2, DRAW_LINE);
 SetIndexDrawBegin(2,Lookback);
SetIndexBuffer(3, value);
SetIndexStyle(3, DRAW_NONE);
//SetIndexEmptyValue(3,0.0);
//SetIndexEmptyValue(2,0.0);
SetIndexBuffer(4, buffer);
    SetIndexEmptyValue( 0, EMPTY_VALUE );
   SetIndexEmptyValue( 1, EMPTY_VALUE );
 SetIndexDrawBegin(0,Lookback);
 SetIndexDrawBegin(1,Lookback);
 SetIndexDrawBegin(3,Lookback);
 SetIndexDrawBegin(4,Lookback);

   IndicatorShortName("Ahoora Version 1.1:By farshad saremifar " );


//----
   return(0);
  }
//+------------------------------------------------------------------+
//| Custom indicator deinitialization function                       |
//+------------------------------------------------------------------+
int deinit()
  {
//----

//----
   return(0);
  }
//+------------------------------------------------------------------+
//| Custom indicator iteration function                              |
//+------------------------------------------------------------------+
int start()
  {


 int bars;
   int    counted_bars=IndicatorCounted();


   if (counted_bars < 0) return (-1);
   if (counted_bars > 0) counted_bars--;
   //if (FillHole) bars = Bars-counted_bars;
    bars = Bars-counted_bars;

//----
   for (int i = bars-1; i >= 0; i--) {
     // buffer[i] = buffer[i + 1];
     // value[i]=value[i+1];
      RefreshRates();
      if (High[i] > iMA(Symbol(), 0, Lookback, 0, ma_method, PRICE_HIGH, i )) buffer[i] = 1;
      if (Low[i] < iMA(Symbol(), 0, Lookback, 0, ma_method, PRICE_LOW, i)) buffer[i] = -1;


   }
for ( i = bars-1; i >= 0; i--) {
 if (buffer[i] < 0) {
     value[i]=iMA(Symbol(), 0, Lookback, 0, ma_method, PRICE_HIGH, i)-iATR(Symbol(),0,Lookback,i);

     } else {

      value[i]=iATR(Symbol(),0,Lookback,i)+iMA(Symbol(), 0, Lookback, 0, ma_method, PRICE_LOW, i );
     }
  }
//----
int j=0;
if (FillHole) j=1;
   else j = 0;

for ( i = bars-1; i >= 0; i--)
{

value2[i]=iRSIOnArray(value,0,Lookback,i);


 }
for ( i = bars; i >= 0; i--)
{
  if (buffer[i] < 0) {
         down[i] = value2[i];
         up[i] = EMPTY_VALUE;
      } else if (buffer[i] > 0){
         down[i] =EMPTY_VALUE;
         up[i] = value2[i];
      }

}
   return(0);
  }
//+------------------------------------------------------------------+
Comments