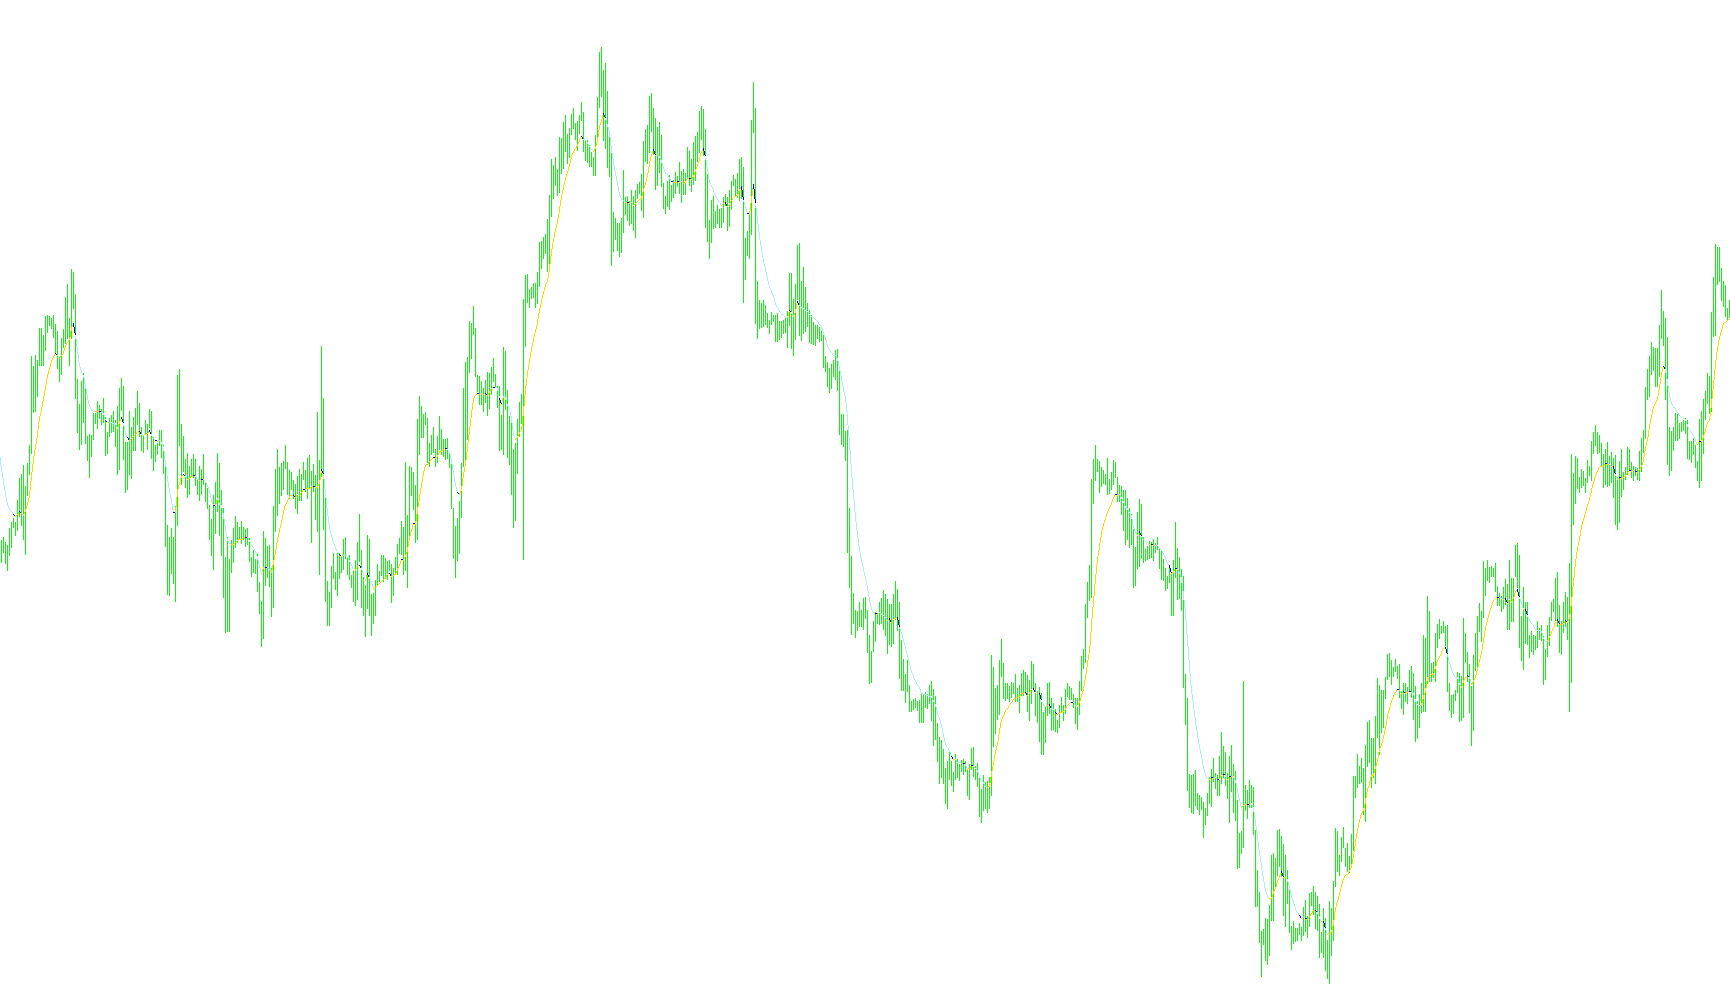
This tool is designed as a visual aid for traders to identify specific trends and momentum shifts in financial markets. It works by analyzing the "Moving Average"—a common technical indicator that smooths out price fluctuations to reveal the underlying direction of the market—and then highlighting specific changes in that movement.
Core Functionality
The script calculates a baseline trend based on a user-defined time period and smoothing method. Instead of just showing this line, the tool monitors how the line moves from one moment to the next. It specifically looks for "downward" movements, where the current value is lower than the previous one.
How the Logic Works
The script follows a specific sequence to determine what to display on your chart:
- Trend Monitoring: The tool continuously tracks the direction of the moving average. When the trend begins to dip (move downward), the script triggers its logic.
- Signal Identification: It distinguishes between new downward movements and continuing ones by checking the history of the previous bars.
- Visual Categorization: The script uses three different layers (buffers) to organize these signals:
- The primary layer calculates the core moving average.
- The second and third layers are used to "mark" specific instances where the price movement behaves in a certain way.
- Specifically, it checks if a downward movement is occurring for the first time or if it is a continuation of a sequence. If a new downward move is detected, it populates one visual area; if the downward trend persists beyond a certain point, it switches to another visual area.
Summary for the User
Essentially, this script filters out "noise" and focuses on the direction of the trend. It highlights moments where the market loses upward momentum, separating initial dips from sustained downward trends. By using different colors (Green and Red) across these three layers, it allows you to see at a glance whether the price is simply fluctuating or if it has entered a more significant downward shift.
//+------------------------------------------------------------------+
//|                                                                  |
//|                                                                  |
//+------------------------------------------------------------------+
//2009fxtsd

#property copyright ""
#property link      ""

#property indicator_chart_window
#property indicator_buffers    3
#property indicator_color1     Green
#property indicator_color2     Red
#property indicator_color3     Red


extern int period      = 11;
extern int method      = 1;

extern int price       = 0;


double buffer1[];
double buffer2[];
double buffer3[];
//+------------------------------------------------------------------+
//|                                                                  |
//+------------------------------------------------------------------+

int init()
{


   SetIndexBuffer(0,buffer1);
   SetIndexBuffer(1,buffer2);
   SetIndexBuffer(2,buffer3);

//   IndicatorShortName("cci triple " +period);
   SetIndexLabel(0,"ma2c " +period);


   return(0);
}


int deinit()
{
   return(0);
}

//+------------------------------------------------------------------+
//|                                                                  |
//+------------------------------------------------------------------+


int start()
{
   int counted_bars=IndicatorCounted();
   int limit,i;

   if(counted_bars<0) return(-1);
   if(counted_bars>0) counted_bars--;
           limit=Bars-counted_bars;


   for(i=limit; i>=0; i--)
   {

     buffer1[i]  = iMA(NULL, 0, period, 0,method , price, i);


               buffer2[i]=EMPTY_VALUE;       buffer3[i]=EMPTY_VALUE;


      if (buffer1[i]<buffer1[i+1])
      {

            if(buffer2[i+2]==EMPTY_VALUE)
            {
               buffer2[i]=buffer1[i];        buffer2[i+1]=buffer1[i+1];
                 }

            else
            {
               buffer3[i]=buffer1[i];        buffer3[i+1]=buffer1[i+1];
                  }
      }


   }

   return(0);
}
Comments