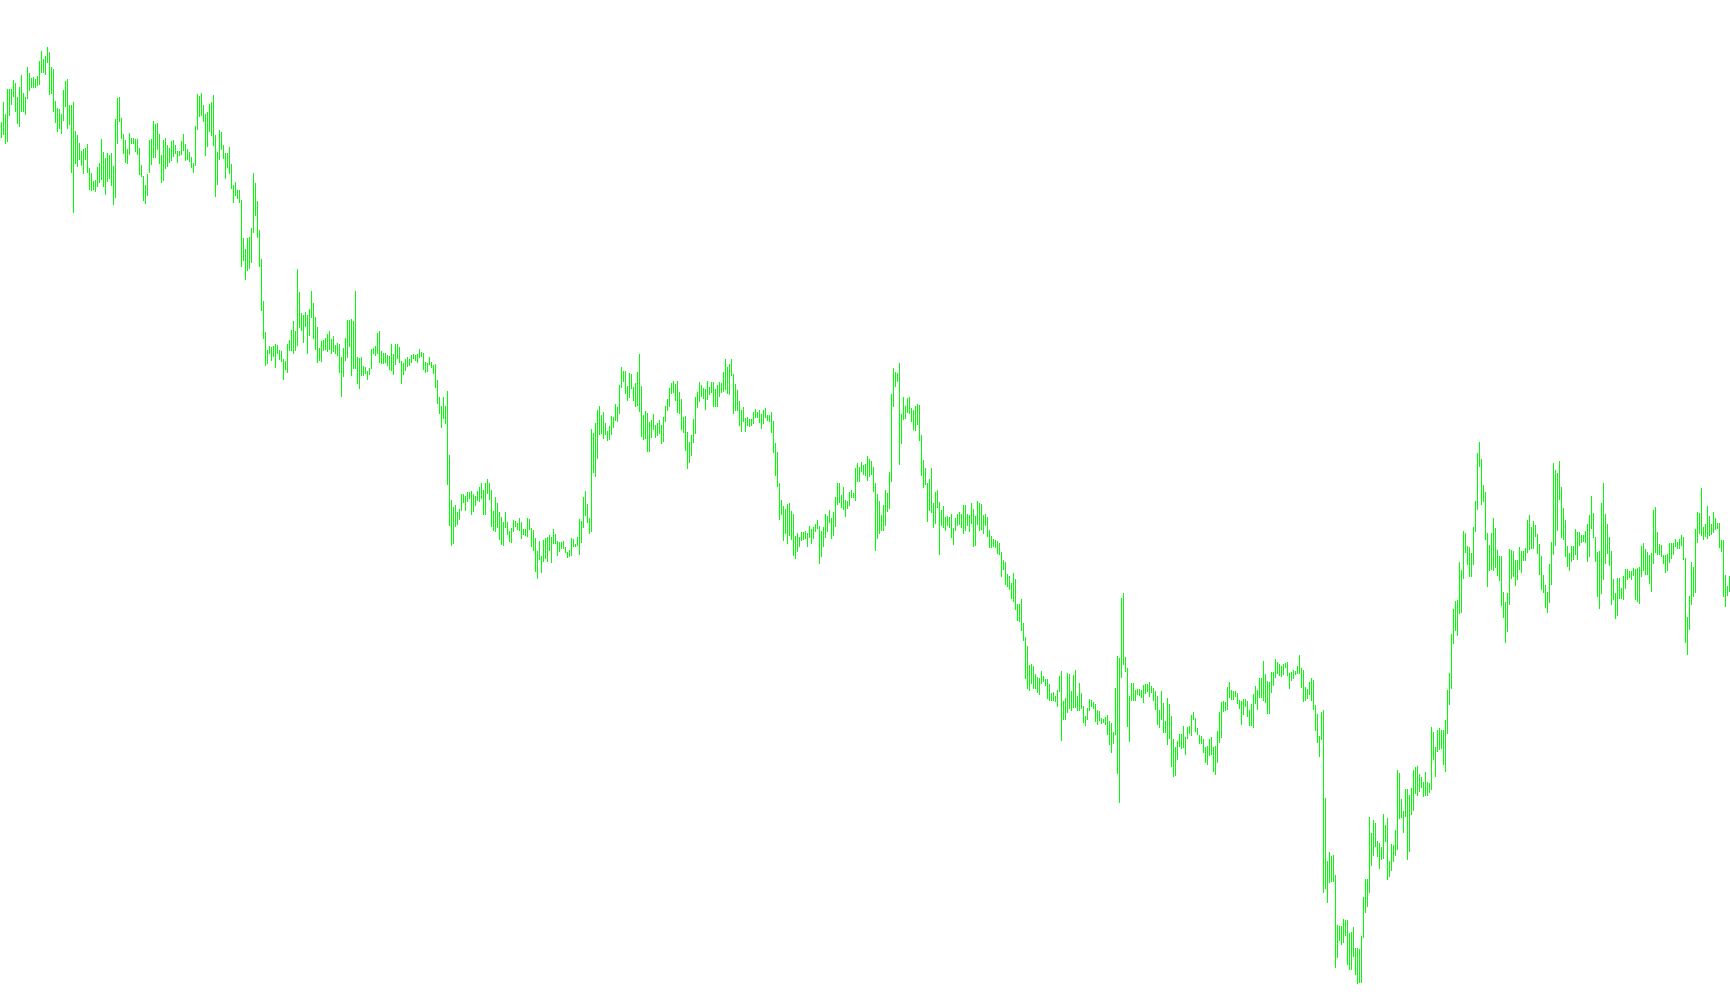
This tool is a sophisticated technical analysis indicator designed to model and project price movements using advanced mathematical forecasting. Rather than relying on simple moving averages or basic trend lines, it employs a method of polynomial regression to "smooth out" market noise and identify the underlying trajectory of the asset's price.
Core Logic and Methodology
The script functions through several distinct stages of data processing:
1. Data Collection and Windowing The indicator begins by establishing a specific look-back period based on the user’s hourly settings. It captures a segment of historical closing prices, creating a mathematical "window" of time to analyze how the price has behaved recently.
2. Polynomial Regression Modeling To find the path of least resistance in the market, the script uses a method known as Gaussian Elimination. It builds a system of linear equations to determine the coefficients of a polynomial curve that best fits the existing price data.
- Think of this like drawing a "best-fit" curve through a scatter plot of dots; the more complex the settings, the more fluid and flexible the curve can be to match the price action.
3. Predictive Projection Once the mathematical curve is established, the script calculates the trajectory forward. It uses the coefficients derived from the past data to project where the price "should" be heading next. This allows the indicator to visualize a projected path, helping traders see potential targets or trend continuations.
4. Dynamic Volatility and Boundary Detection The tool does not just provide a single line; it also calculates risk and volatility boundaries. It computes several different layers of variance:
- Standard Deviation Channels: It measures how far the price typically deviates from the projected path.
- Upper and Lower Boundaries: Based on these deviations, the script generates multiple "zones" (High and Low boundaries). These act as a visual corridor, indicating where the price is likely to fluctuate within a certain level of confidence.
Visual Representation
On your chart, the logic manifests as a series of lines:
- The Primary Path: A central trend line representing the smoothed, projected direction of the price.
- The Boundaries: Surrounding lines that expand or contract based on market volatility. When the market is calm, these boundaries tighten; during periods of high volatility, they widen to reflect the increased uncertainty.
Summary for the User
In short, this script acts as a "trend-finder." It ignores minor price fluctuations to find the true mathematical curve of the market. By projecting that curve forward and surrounding it with volatility boundaries, it helps you visualize the likely path of the price while providing a visual guide for potential overbought or oversold extremes.
#property  copyright "ANG3110@latchess.com"
//---------ang_PR (Din)--------------------
#property indicator_chart_window
#property indicator_buffers 5
#property indicator_color1 DeepSkyBlue
#property indicator_color2 Lime
#property indicator_color3 Lime
#property indicator_color4 Yellow
#property indicator_color5 Yellow
//-----------------------------------
extern double hours = 120.0;
extern int m = 2;
extern int i = 0;
extern int kstd = 2;
extern int sName = 1102;
//-----------------------
double fx[], sqh[], sql[], stdh[], stdl[];
double ai[10,10], b[10], x[10], sx[20];
double sum;
int    ip, p, n, f;
double qq, mm, tt;
int    ii, jj, kk, ll, nn;
double sq, std;
//*******************************************
int init()
{
   IndicatorShortName("at_PR (Din)");
   SetIndexStyle(0, DRAW_LINE);
   SetIndexBuffer(0, fx);
   SetIndexBuffer(1, sqh);
   SetIndexBuffer(2, sql);
   SetIndexBuffer(3, stdh);
   SetIndexBuffer(4, stdl);
   p = MathRound(hours * 60.0 / Period());
   nn = m + 1;
   ObjectCreate("pr" + sName, 22, 0, Time[p], fx[p]);
   ObjectSet("pr" + sName, 14, 159);
   return(0);
}
//----------------------------------------------------------
int deinit()
{
   ObjectDelete("pr" + sName);
}
//**********************************************************************************************
int start()
{
   int mi;
//-------------------------------------------------------------------------------------------
   ip = iBarShift(Symbol(), Period(), ObjectGet("pr" + sName, OBJPROP_TIME1));
   p = ip;
   sx[1] = p + 1;
   SetIndexDrawBegin(0, Bars - p - 1);
   SetIndexDrawBegin(1, Bars - p - 1);
   SetIndexDrawBegin(2, Bars - p - 1);
   SetIndexDrawBegin(3, Bars - p - 1);
   SetIndexDrawBegin(4, Bars - p - 1);
//----------------------sx-------------------------------------------------------------------
   for(mi = 1; mi <= nn * 2 - 2; mi++)
   {
      sum = 0;
      for(n = i; n <= i + p; n++)
      {
         sum += MathPow(n, mi);
      }
      sx[mi + 1] = sum;
   }
//----------------------syx-----------
   for(mi = 1; mi <= nn; mi++)
   {
      sum = 0.00000;
      for(n = i; n <= i + p; n++)
      {
         if(mi == 1)
            sum += Close[n];
         else
            sum += Close[n] * MathPow(n, mi - 1);
      }
      b[mi] = sum;
   }
//===============Matrix=======================================================================================================
   for(jj = 1; jj <= nn; jj++)
   {
      for(ii = 1; ii <= nn; ii++)
      {
         kk = ii + jj - 1;
         ai[ii, jj] = sx[kk];
      }
   }
//===============Gauss========================================================================================================
   for(kk = 1; kk <= nn - 1; kk++)
   {
      ll = 0; mm = 0;
      for(ii = kk; ii <= nn; ii++)
      {
         if(MathAbs(ai[ii, kk]) > mm)
         {
            mm = MathAbs(ai[ii, kk]);
            ll = ii;
         }
      }
      if(ll == 0)
         return(0);

      if(ll != kk)
      {
         for(jj = 1; jj <= nn; jj++)
         {
            tt = ai[kk, jj];
            ai[kk, jj] = ai[ll, jj];
            ai[ll, jj] = tt;
         }
         tt = b[kk]; b[kk] = b[ll]; b[ll] = tt;
      }
      for(ii = kk + 1; ii <= nn; ii++)
      {
         qq = ai[ii, kk] / ai[kk, kk];
         for(jj = 1; jj <= nn; jj++)
         {
            if(jj == kk)
               ai[ii, jj] = 0;
            else
               ai[ii, jj] = ai[ii, jj] - qq * ai[kk, jj];
         }
         b[ii] = b[ii] - qq * b[kk];
      }
   }
   x[nn] = b[nn] / ai[nn, nn];
   for(ii = nn - 1; ii >= 1; ii--)
   {
      tt = 0;
      for(jj = 1; jj <= nn - ii; jj++)
      {
         tt = tt + ai[ii, ii + jj] * x[ii + jj];
         x[ii] = (1 / ai[ii, ii]) * (b[ii] - tt);
      }
   }
//===========================================================================================================================
   for(n = i; n <= i + p; n++)
   {
      sum = 0;
      for(kk = 1; kk <= m; kk++)
      {
         sum += x[kk + 1] * MathPow(n, kk);
      }
      fx[n] = x[1] + sum;
   }
//-----------------------------------Std-----------------------------------------------------------------------------------
   sq = 0.0;
   for(n = i; n <= i + p; n++)
   {
      sq += MathPow(Close[n] - fx[n], 2);
   }
   sq = MathSqrt(sq / (p + 1)) * kstd;
   std = iStdDev(NULL, 0, p, MODE_SMA, 0, PRICE_CLOSE, i) * kstd;
   for(n = i; n <= i + p; n++)
   {
      sqh[n] = fx[n] + sq;
      sql[n] = fx[n] - sq;
      stdh[n] = fx[n] + std;
      stdl[n] = fx[n] - std;
   }
//-------------------------------------------------------------------------------
   ObjectMove("pr" + sName, 0, Time[p], fx[p]);
//----------------------------------------------------------------------------------------------------------------------------
   return(0);
}
//==========================================================================================================================
Comments