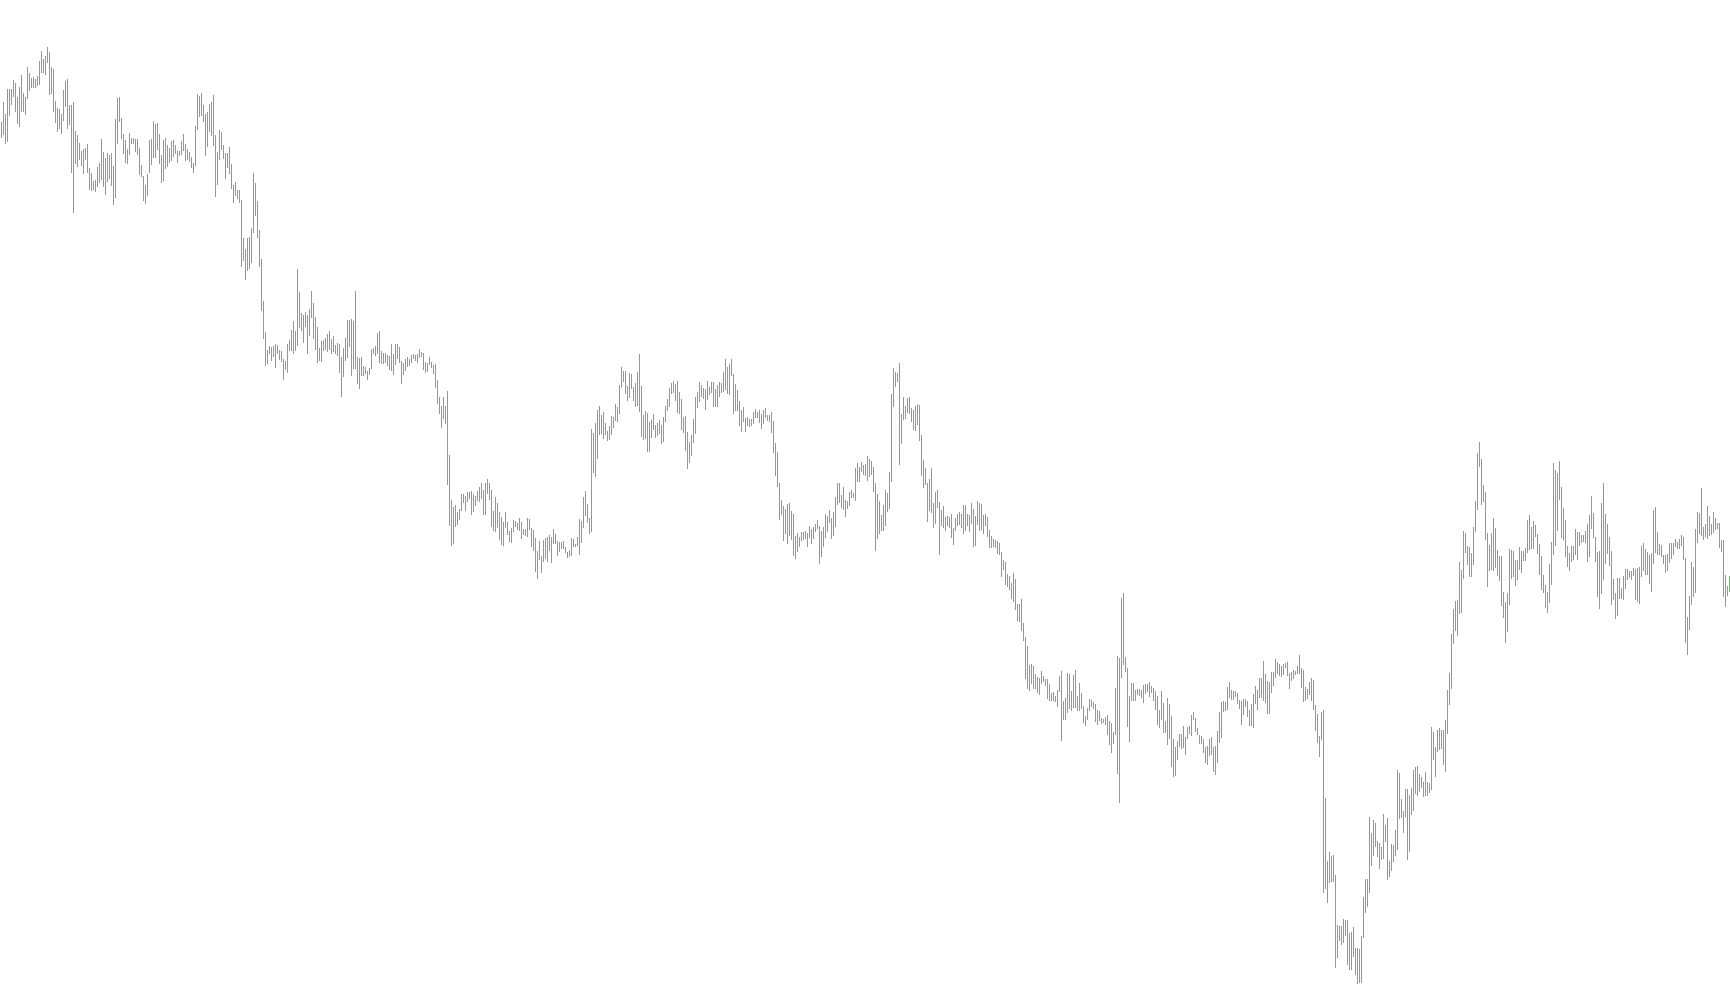
This technical indicator is designed to identify potential trend reversals on a trading chart by analyzing price action momentum and volatility. Instead of simply following price movement, the logic focuses on "filtering out" market noise to find significant structural shifts.
Core Logic and Methodology
The script operates by analyzing the relationship between current price volatility and historical momentum through the following three stages:
1. Volatility and Movement Analysis The tool first calculates the average range of price movement over a small window of recent bars (the difference between highs and lows). It then looks for specific "breakout" behaviors:
- It checks if the gap between the opening and closing prices exceeds a certain multiple of the average volatility.
- It evaluates the magnitude of price swings to determine if the current move is a meaningful trend change or just standard market fluctuation.
2. Dynamic Momentum Filtering The script uses these calculations to adjust how it views momentum. Rather than using a fixed setting, it dynamically shifts its internal parameters based on whether a significant price breakout was detected. If the market shows high-intensity movement, the indicator adjusts its sensitivity levels to better capture the strength of that move. It specifically looks for "overbought" or "oversold" conditions relative to these dynamic thresholds.
3. Signal Generation (The Arrows) The final output is visualized as arrows on the chart:
- Bullish Signals: When the momentum falls below a specific lower threshold and then shows a confirmed reversal back toward the center, the script places an arrow above the high of the candle.
- Bearish Signals: When the momentum rises above a specific upper threshold and subsequently shows a confirmed reversal back toward the center, the script places an arrow below the low of the candle.
Key Features for the User
- Risk Adjustment: The logic includes a "Risk" parameter that allows you to widen or tighten the thresholds. Increasing this value makes the indicator more conservative (requiring stronger moves to trigger a signal), while decreasing it makes it more sensitive to smaller fluctuations.
- Trend Awareness: By calculating the "Range" of the market, the indicator scales itself automatically. This means the signals are relative to current market conditions—functioning effectively in both high-volatility environments and quieter trading periods.
- Visual Clarity: The script is designed to be clean, providing clear visual cues (Magenta and Yellow arrows) directly on the main price chart without cluttering the screen with extra windows.
//+------------------------------------------------------------------+
//| ASCTrend1sig_noSound.mq4
//| Ramdass - Conversion only
//+------------------------------------------------------------------+

#property indicator_chart_window
#property indicator_buffers 2
#property indicator_color1 Magenta
#property indicator_color2 Yellow

//---- input_parameters
extern int RISK=3;
extern int CountBars=300;

//---- buffers
double val1[];
double val2[];


//+------------------------------------------------------------------+
//| Custom indicator initialization function                         |
//+------------------------------------------------------------------+
int init()
  {
//---- indicator line
   IndicatorBuffers(2);
   SetIndexStyle(0,DRAW_ARROW);
   SetIndexArrow(0,234);
   SetIndexStyle(1,DRAW_ARROW);
   SetIndexArrow(1,233);
   SetIndexBuffer(0,val1);
   SetIndexBuffer(1,val2);

//----
   return(0);
  }
//+------------------------------------------------------------------+
//| ASCTrend1sig                                                     |
//+------------------------------------------------------------------+
int start()
  {
   if (CountBars>=10000000) CountBars=9500000;
   SetIndexDrawBegin(0,Bars-CountBars+11+1);
   SetIndexDrawBegin(1,Bars-CountBars+11+1);
   int i,shift,counted_bars=IndicatorCounted();
   int Counter,i1,value10,value11;
   double value1,x1,x2;
   double value2,value3;
   double TrueCount,Range,AvgRange,MRO1,MRO2;
   double Table_value2[1000];

   value10=3+RISK*2;
   x1=67+RISK;
   x2=33-RISK;
   value11=value10;
//----
   if(Bars<=11+1) return(0);
//---- initial zero
   if(counted_bars<11+1)
   {
      for(i=1;i<=0;i++) val1[CountBars-i]=0.0;
      for(i=1;i<=0;i++) val2[CountBars-i]=0.0;
   }
//----
   shift=CountBars-11-1;
   while(shift>=0)
     {

   Counter=shift;
	Range=0.0;
	AvgRange=0.0;
	for (Counter=shift; Counter<=shift+9; Counter++) AvgRange=AvgRange+MathAbs(High[Counter]-Low[Counter]);

	Range=AvgRange/10;
	Counter=shift;
	TrueCount=0;
	while (Counter<shift+9 && TrueCount<1)
		{if (MathAbs(Open[Counter]-Close[Counter+1])>=Range*2.0) TrueCount=TrueCount+1;
		Counter=Counter+1;
		}
	if (TrueCount>=1) {MRO1=Counter;} else {MRO1=-1;}
	Counter=shift;
	TrueCount=0;
	while (Counter<shift+6 && TrueCount<1)
		{if (MathAbs(Close[Counter+3]-Close[Counter])>=Range*4.6) TrueCount=TrueCount+1;
		Counter=Counter+1;
		}
	if (TrueCount>=1) {MRO2=Counter;} else {MRO2=-1;}
	if (MRO1>-1) {value11=3;} else {value11=value10;}
	if (MRO2>-1) {value11=4;} else {value11=value10;}
	value2=100-MathAbs(iWPR(NULL,NULL,value11,shift)); // PercentR(value11=9)
	Table_value2[shift]=value2;
	val1[shift]=0;
	val2[shift]=0;
	value3=0;
	if (value2<x2)
		{i1=1;
		while (Table_value2[shift+i1]>=x2 && Table_value2[shift+i1]<=x1){i1++;}
		if (Table_value2[shift+i1]>x1)
			{
			value3=High[shift]+Range*0.5;
			val1[shift]=value3;
			}
		}
	if (value2>x1)
		{i1=1;
		while (Table_value2[shift+i1]>=x2 && Table_value2[shift+i1]<=x1){i1++;}
		if (Table_value2[shift+i1]<x2)
			{
			value3=Low[shift]-Range*0.5;
			val2[shift]=value3;
			}
		}

      shift--;
     }

   return(0);
  }
//+------------------------------------------------------------------+
Comments