Price
Download script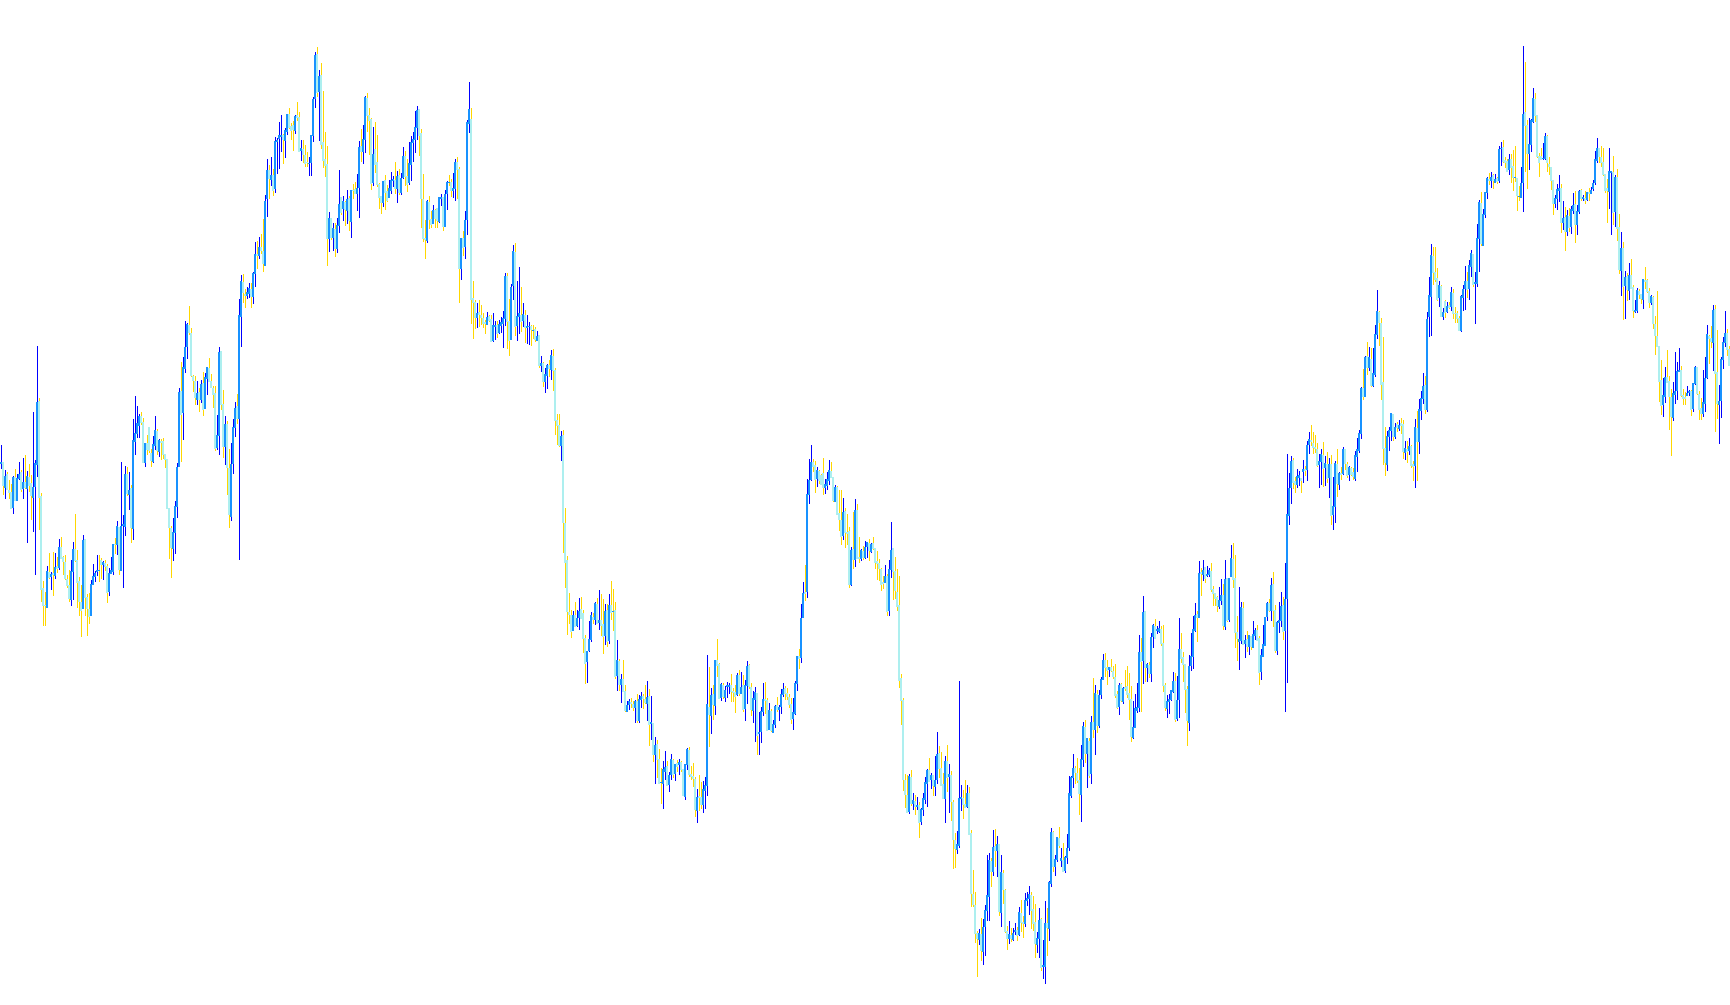
This script is designed to transform the standard visual representation of price movements on your trading chart into a specialized format known as Heiken Ashi. Unlike traditional candlesticks, which can often appear "noisy" or erratic due to minor price fluctuations, this tool smooths out the data to provide a clearer picture of market trends.
How it Works
The logic of this script focuses on identifying the core momentum of the market by recalculating price points. Here is a breakdown of the process:
- Trend Smoothing: Instead of simply showing you the raw high and low prices for every minute or hour, the script analyzes the relationship between the opening and closing prices of each period.
- Dynamic Price Mapping: The script determines whether a specific period was "bullish" (price went up) or "bearish" (price went down). It then intelligently assigns values to create a more balanced visual:
- If the price closed higher than it opened, it adjusts the visual boundaries to highlight upward momentum.
- If the price closed lower than it opened, it adjusts the boundaries to emphasize downward pressure.
- Visual Consistency: By reorganizing these data points into four distinct "buffers," the script ensures that the resulting bars on your chart flow more fluidly. This helps traders see the overall direction of the market (the "trend") without being distracted by the small, jagged movements that often occur in standard charts.
Key Benefits for the User
- Improved Clarity: It filters out minor market "noise," making it easier to see if the price is moving consistently in one direction.
- Trend Identification: Because the bars are visually smoothed, it becomes much simpler to identify when a trend is beginning, sustaining, or reversing.
- Seamless Integration: The script works by overlaying these calculations directly onto your existing chart, allowing you to view the market through a lens that prioritizes momentum and flow over raw volatility.
Miscellaneous
13
Views
0
Downloads
0
Favorites
Price
//+------------------------------------------------------------------+
//|                                                  Heiken Ashi.mq4 |
//|                      Copyright © 2004, MetaQuotes Software Corp. |
//|                                        http://www.metaquotes.net |
//+------------------------------------------------------------------+
//| For Heiken Ashi we recommend next chart settings ( press F8 or   |
//| select on menu 'Charts'->'Properties...'):                       |
//|  - On 'Color' Tab select 'Black' for 'Line Graph'                |
//|  - On 'Common' Tab disable 'Chart on Foreground' checkbox and    |
//|    select 'Line Chart' radiobutton                               |
//+------------------------------------------------------------------+
#property copyright "Copyright © 2004, MetaQuotes Software Corp."
#property link      "http://www.metaquotes.net"

#property indicator_chart_window
#property indicator_buffers 4
#property indicator_color1 Red
#property indicator_color2 RoyalBlue
#property indicator_color3 Red
#property indicator_color4 RoyalBlue
//---- buffers
double ExtMapBuffer1[];
double ExtMapBuffer2[];
double ExtMapBuffer3[];
double ExtMapBuffer4[];
//----
int ExtCountedBars=0;
//+------------------------------------------------------------------+
//| Custom indicator initialization function                         |
//|------------------------------------------------------------------|
int init()
  {
//---- indicators
   SetIndexStyle(0,DRAW_HISTOGRAM, 0, 1);
   SetIndexBuffer(0, ExtMapBuffer1);
   SetIndexStyle(1,DRAW_HISTOGRAM, 0, 1);
   SetIndexBuffer(1, ExtMapBuffer2);
   SetIndexStyle(2,DRAW_HISTOGRAM, 0, 3);
   SetIndexBuffer(2, ExtMapBuffer3);
   SetIndexStyle(3,DRAW_HISTOGRAM, 0, 3);
   SetIndexBuffer(3, ExtMapBuffer4);
//----
   SetIndexDrawBegin(0,5);
//---- indicator buffers mapping
   SetIndexBuffer(0,ExtMapBuffer1);
   SetIndexBuffer(1,ExtMapBuffer2);
   SetIndexBuffer(2,ExtMapBuffer3);
   SetIndexBuffer(3,ExtMapBuffer4);
//---- initialization done
   return(0);
  }
//+------------------------------------------------------------------+
//| Custor indicator deinitialization function                       |
//+------------------------------------------------------------------+
int deinit()
  {
//---- TODO: add your code here

//----
   return(0);
  }
//+------------------------------------------------------------------+
//| Custom indicator iteration function                              |
//+------------------------------------------------------------------+
int start()
  {
   double BarOpen, BarHigh, BarLow, BarClose;
   if(Bars<=10) return(0);
   ExtCountedBars=IndicatorCounted();
//---- check for possible errors
   if (ExtCountedBars<0) return(-1);
//---- last counted bar will be recounted
   if (ExtCountedBars>0) ExtCountedBars--;
   int pos=Bars-ExtCountedBars-1;
   while(pos>=0)
     {
      BarOpen=Open[pos];
      BarClose=Close[pos];
      BarHigh=High[pos];
      BarLow=Low[pos];
      if (BarOpen<BarClose)
        {
         ExtMapBuffer1[pos]=BarLow;
         ExtMapBuffer2[pos]=BarHigh;
        }
      else
        {
         ExtMapBuffer1[pos]=BarHigh;
         ExtMapBuffer2[pos]=BarLow;
        }
      ExtMapBuffer3[pos]=BarOpen;
      ExtMapBuffer4[pos]=BarClose;
 	   pos--;
     }
//----
   return(0);
  }
//+------------------------------------------------------------------+
Comments