ASCTrend1_v3
Download script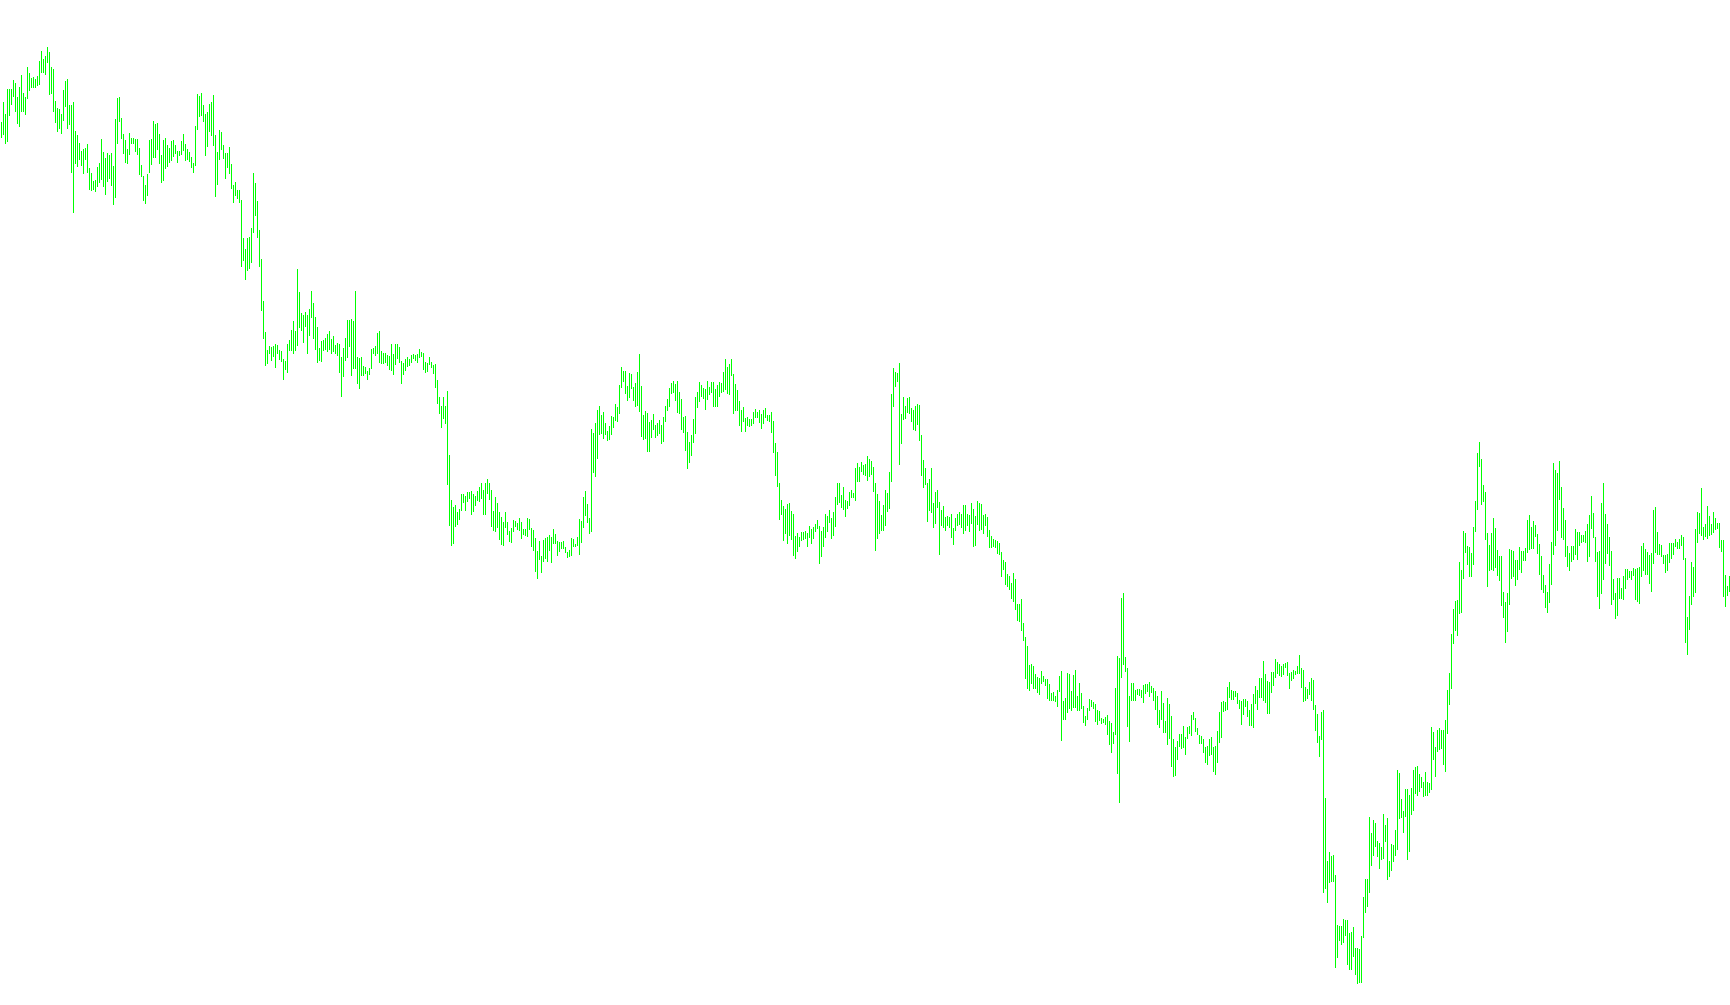
The ASCTrend1 indicator is designed to analyze market price action and identify potential trend reversals or momentum shifts by calculating specific price movements relative to historical averages. Rather than simply following a moving average, this tool evaluates the "strength" of current price candles against recent volatility to determine if the market is entering a state of overextension.
Core Logic and Mechanism
The script operates by performing three primary analytical steps for every candle on your chart:
1. Volatility Measurement The indicator first establishes a baseline for "normal" price movement. It looks at a window of recent candles to calculate the average range (the difference between the high and low prices). This ensures that the tool adapts to different market conditions—it will behave differently in a highly volatile news environment than it would during a quiet, sideways consolidation.
2. Dynamic Movement Detection Once the average range is established, the logic searches for two specific types of price "breaks":
- Gap Analysis: It looks for significant gaps between the opening prices of consecutive candles relative to the average volatility.
- Momentum Expansion: It scans for rapid, aggressive movements where the price travels a specific multiple of the average range within a very short number of candles.
3. Sentiment Calculation (WPR Integration) The indicator uses these movement detections to dynamically adjust its internal settings. By identifying if a significant "breakout" or "surge" has occurred, it modifies its sensitivity levels. It then applies a specialized calculation (similar to the Williams Percent Range) to determine where the current price sits relative to its recent highs and lows as a percentage.
Visual Output
The results are displayed as vertical histograms on your chart:
- Red Highlights: These appear when the calculated momentum suggests the market is reaching an upper extreme or overbought territory based on the established risk parameters.
- Lime Highlights: These appear when the momentum suggests a lower extreme or oversold territory.
Essentially, the script acts as a filter that ignores standard "noise" and only highlights moments where price movement becomes mathematically significant enough to suggest a potential change in trend direction. By adjusting the "Risk" parameter, you can control how sensitive the indicator is to these price surges.
/*-----------------------------+
|			       |
| Shared by www.Aptrafx.com    |
|			       |
+------------------------------*/

//+------------------------------------------------------------------+
//| ASCTrend1
//| Ramdass - Conversion only
//+------------------------------------------------------------------+

#property indicator_chart_window
#property indicator_buffers 2
#property indicator_color1 Red
#property indicator_color2 Lime

//---- input parameters
extern int RISK=3;
extern int CountBars=300;

//---- buffers
double val1[];
double val2[];

//+------------------------------------------------------------------+
//| Custom indicator initialization function                         |
//+------------------------------------------------------------------+
int init()
  {
//---- indicator line
   IndicatorBuffers(2);
   SetIndexStyle(0,DRAW_HISTOGRAM,0,1);
   SetIndexStyle(1,DRAW_HISTOGRAM,0,1);
   SetIndexBuffer(0,val1);
   SetIndexBuffer(1,val2);

//----
   return(0);
  }
//+------------------------------------------------------------------+
//| ASCTrend1                                                  |
//+------------------------------------------------------------------+
int start()
  {
   if (CountBars>=Bars) CountBars=Bars;
   SetIndexDrawBegin(0,Bars-CountBars+11+1);
   SetIndexDrawBegin(1,Bars-CountBars+11+1);
   int i,shift,counted_bars=IndicatorCounted();
   int Counter,i1,value10,value11;
   double value1,x1,x2;
   double value2,value3;
   double TrueCount,Range,AvgRange,MRO1,MRO2;

   value10=3+RISK*2;
   x1=67+RISK;
   x2=33-RISK;
   value11=value10;
//----
   if(Bars<=value11+1) return(0);
//---- initial zero
   if(counted_bars<value11+1)
   {
      for(i=1;i<=0;i++) val1[CountBars-i]=0.0;
      for(i=1;i<=0;i++) val2[CountBars-i]=0.0;
   }
//----
   shift=CountBars-11-1;
   while(shift>=0)
     {

   Counter=shift;
	Range=0.0;
	AvgRange=0.0;
	for (Counter=shift; Counter<=shift+9; Counter++) AvgRange=AvgRange+MathAbs(High[Counter]-Low[Counter]);

	Range=AvgRange/10;
	Counter=shift;
	TrueCount=0;
	while (Counter<shift+9 && TrueCount<1)
		{if (MathAbs(Open[Counter]-Close[Counter+1])>=Range*2.0) TrueCount=TrueCount+1;
		Counter=Counter+1;
		}
	if (TrueCount>=1) {MRO1=Counter;} else {MRO1=-1;}
	Counter=shift;
	TrueCount=0;
	while (Counter<shift+6 && TrueCount<1)
		{if (MathAbs(Close[Counter+3]-Close[Counter])>=Range*4.6) TrueCount=TrueCount+1;
		Counter=Counter+1;
		}
	if (TrueCount>=1) {MRO2=Counter;} else {MRO2=-1;}
	if (MRO1>-1) {value11=3;} else {value11=value10;}
	if (MRO2>-1) {value11=4;} else {value11=value10;}
	value2=100-MathAbs(iWPR(NULL,0,value11,shift)); // PercentR(value11=9)
   val1[shift]=0;
	val2[shift]=0;
	if (value2>x1)
		{
		val1[shift]=Low[shift]; val2[shift]=High[shift];
		}
	if (value2<x2)
		{
		val1[shift]=High[shift]; val2[shift]=Low[shift];
		}

      shift--;
     }

   return(0);
  }
//+------------------------------------------------------------------+
Comments