EJ_Trend
Download script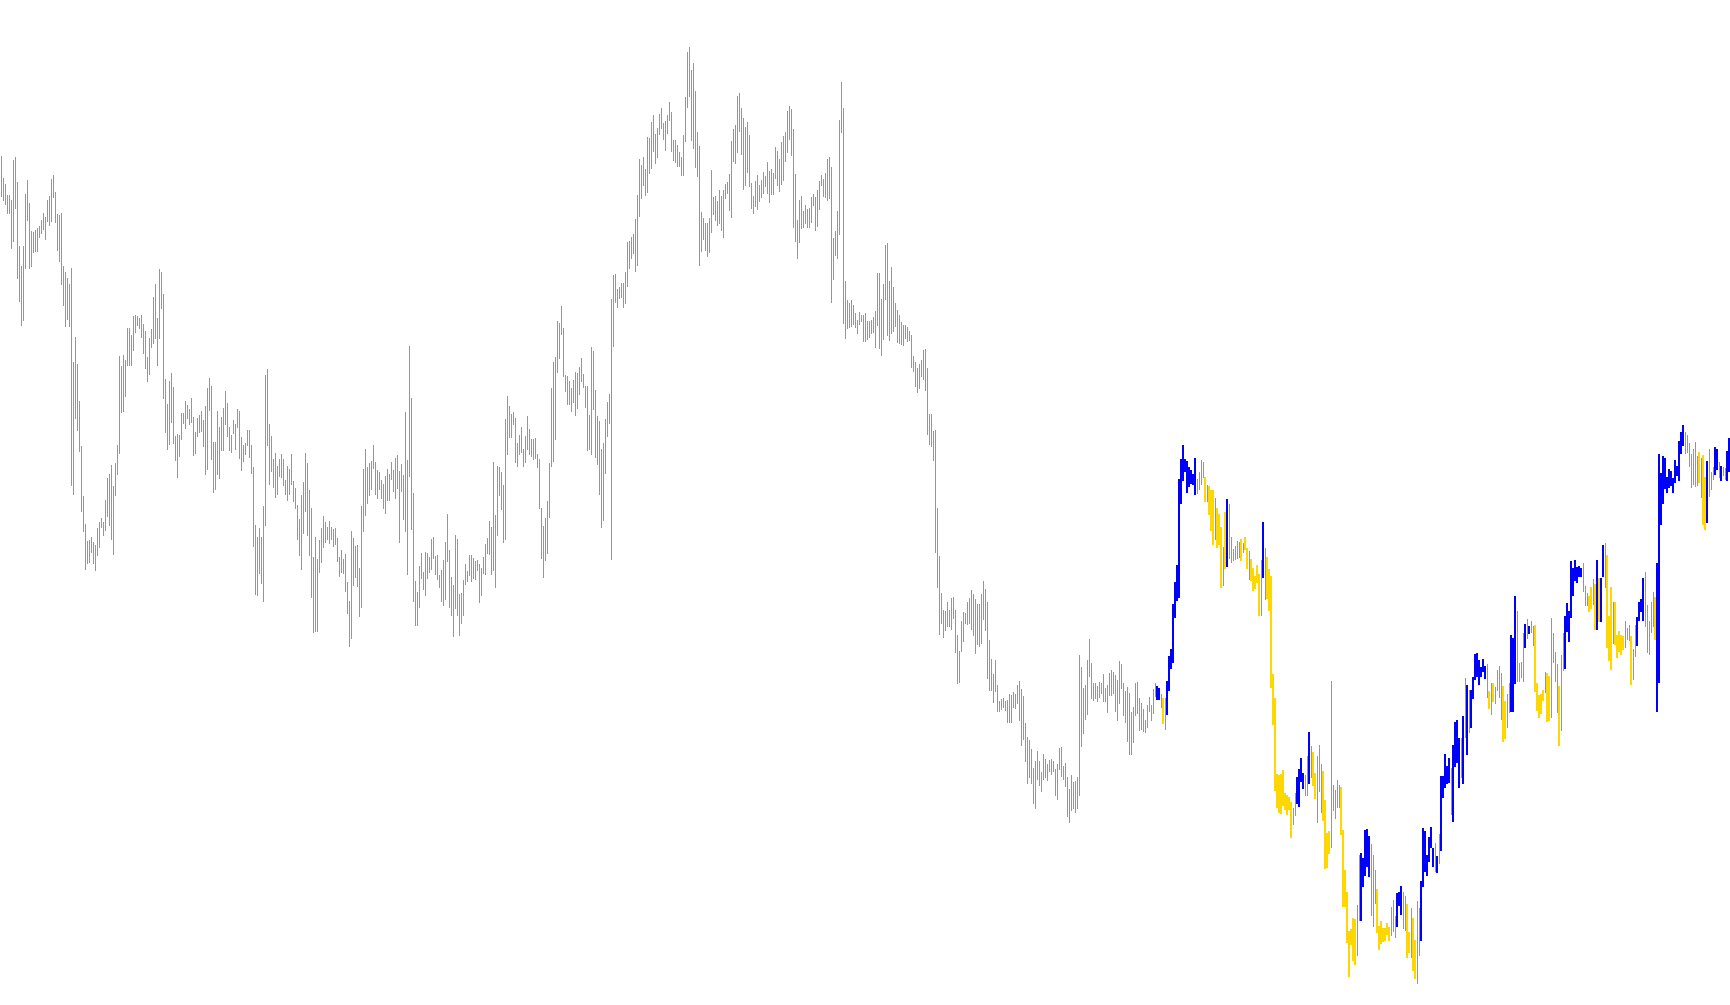
This tool is designed to help traders identify and visualize market trends by analyzing price action and volatility. Instead of simply following every minor price movement, the script uses a logic-based approach to filter out "noise" and highlight significant shifts in momentum.
How the Logic Works
The core functionality of the script revolves around three main stages of analysis:
1. Volatility Measurement The script first looks at a specific window of recent price history to calculate the average range (the distance between the high and low prices). By understanding the "normal" size of price movements in the current market, it establishes a baseline for what constitutes a significant move versus an insignificant fluctuation.
2. Significant Move Detection Once it knows the average volatility, the script searches for two specific types of aggressive price actions:
- Gap/Price Jump Analysis: It looks for instances where the gap between the opening and closing prices is significantly larger than the average range.
- Momentum Acceleration: It checks if the price has moved over a specific distance within a very short timeframe, indicating a surge in buying or selling pressure.
If the script detects these high-momentum moves, it adjusts its sensitivity settings automatically. If the market is behaving "normally," it remains conservative; if it detects a breakout or a sharp surge, it updates its internal parameters to react more dynamically to the new price trend.
3. Trend Visualization Finally, the script uses a relative strength calculation to determine the current market sentiment. Based on this sentiment and the volatility data gathered:
- It identifies whether the trend is currently bullish (upward) or bearish (downward).
- It then plots visual markers on your chart. These markers act as boundaries, showing you the high and low points of the current trend.
User Experience
For a trader, this means the tool automatically adapts to different market conditions. In a calm market, it provides a stable view of the trend; in a volatile market where prices are jumping rapidly, it senses that change and updates its logic to keep pace with the faster movements. The resulting visual output helps you see where the current trend is "holding" and where potential reversals might be occurring based on real momentum shifts.
/*-----------------------------+
|			       |
| Shared by www.Aptrafx.com    |
|			       |
+------------------------------*/

//+------------------------------------------------------------------+
//| ASCTrend1
//| Ramdass - Conversion only
//+------------------------------------------------------------------+

#property indicator_chart_window
#property indicator_buffers 2
#property indicator_color1 Magenta
#property indicator_color2 Aqua

//---- input parameters
extern int RISK=3;
extern int CountBars=300;

//---- buffers
double val1[];
double val2[];

//+------------------------------------------------------------------+
//| Custom indicator initialization function                         |
//+------------------------------------------------------------------+
int init()
  {
//---- indicator line
   IndicatorBuffers(2);
   SetIndexStyle(0,DRAW_HISTOGRAM,0,2);
   SetIndexStyle(1,DRAW_HISTOGRAM,0,2);
   SetIndexBuffer(0,val1);
   SetIndexBuffer(1,val2);

//----
   return(0);
  }
//+------------------------------------------------------------------+
//| ASCTrend1                                                  |
//+------------------------------------------------------------------+
int start()
  {
   if (CountBars>=Bars) CountBars=Bars;
   SetIndexDrawBegin(0,Bars-CountBars+11+1);
   SetIndexDrawBegin(1,Bars-CountBars+11+1);
   int i,shift,counted_bars=IndicatorCounted();
   int Counter,i1,value10,value11;
   double value1,x1,x2;
   double value2,value3;
   double TrueCount,Range,AvgRange,MRO1,MRO2;

   value10=3+RISK*2;
   x1=67+RISK;
   x2=33-RISK;
   value11=value10;
//----
   if(Bars<=value11+1) return(0);
//---- initial zero
   if(counted_bars<value11+1)
   {
      for(i=1;i<=0;i++) val1[CountBars-i]=0.0;
      for(i=1;i<=0;i++) val2[CountBars-i]=0.0;
   }
//----
   shift=CountBars-11-1;
   while(shift>=0)
     {

   Counter=shift;
	Range=0.0;
	AvgRange=0.0;
	for (Counter=shift; Counter<=shift+9; Counter++) AvgRange=AvgRange+MathAbs(High[Counter]-Low[Counter]);

	Range=AvgRange/10;
	Counter=shift;
	TrueCount=0;
	while (Counter<shift+9 && TrueCount<1)
		{if (MathAbs(Open[Counter]-Close[Counter+1])>=Range*2.0) TrueCount=TrueCount+1;
		Counter=Counter+1;
		}
	if (TrueCount>=1) {MRO1=Counter;} else {MRO1=-1;}
	Counter=shift;
	TrueCount=0;
	while (Counter<shift+6 && TrueCount<1)
		{if (MathAbs(Close[Counter+3]-Close[Counter])>=Range*4.6) TrueCount=TrueCount+1;
		Counter=Counter+1;
		}
	if (TrueCount>=1) {MRO2=Counter;} else {MRO2=-1;}
	if (MRO1>-1) {value11=3;} else {value11=value10;}
	if (MRO2>-1) {value11=4;} else {value11=value10;}
	value2=100-MathAbs(iWPR(NULL,0,value11,shift)); // PercentR(value11=9)
   val1[shift]=0;
	val2[shift]=0;
	if (value2>x1)
		{
		val1[shift]=Low[shift]; val2[shift]=High[shift];
		}
	if (value2<x2)
		{
		val1[shift]=High[shift]; val2[shift]=Low[shift];
		}

      shift--;
     }

   return(0);
  }
//+------------------------------------------------------------------+
Comments