Ask_Shadow_v1
Download script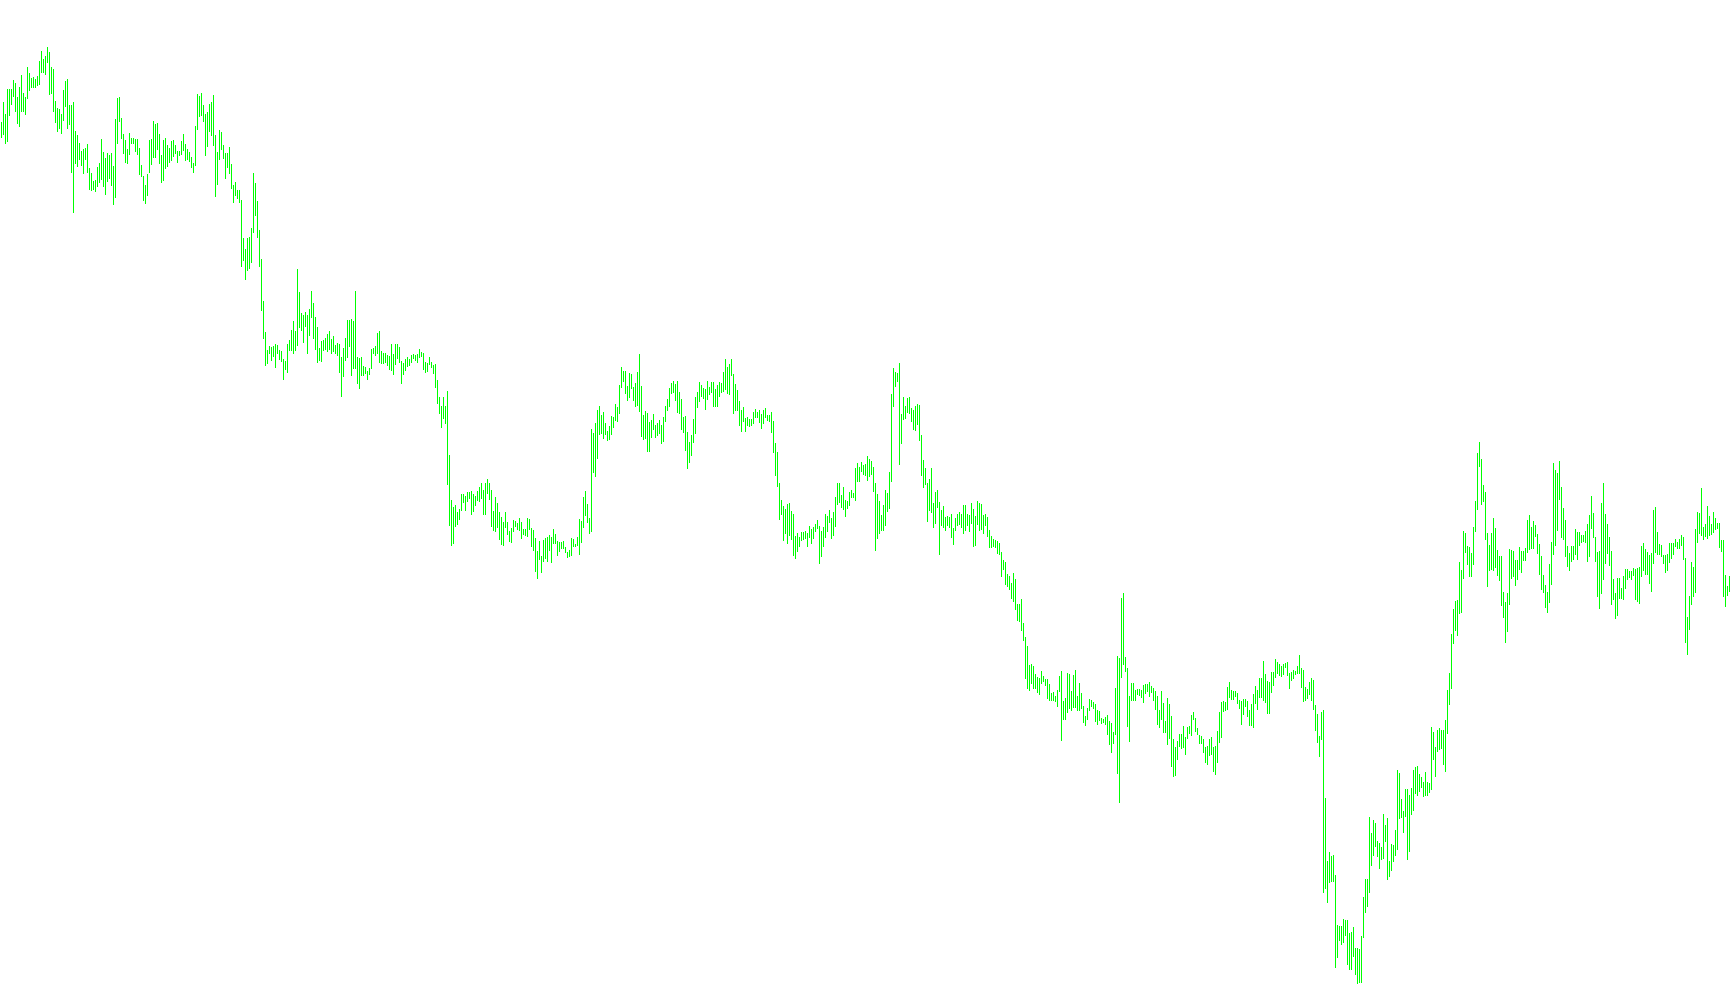
This tool is designed to provide traders with a clearer visual representation of price action by accounting for the "spread"—the difference between the купить (Ask) and продать (Bid) prices. In many trading environments, the spread can significantly affect the actual execution price, and this script helps surface that reality directly on your charts.
How the Logic Works
The script works by calculating two distinct price points for every candle on your chart:
- Standard High Price: It identifies the highest point reached during a specific time period (the "High" of the candle).
- Adjusted High Price: It takes that same high price and adds the current market spread to it. This represents a more realistic "ceiling" for entry or exit, reflecting the cost of the transaction.
Visual Representation
Instead of just showing you standard price bars, the script translates these calculations into visual histograms on your screen. By displaying both the raw high and the spread-adjusted high simultaneously, the tool allows you to see the "shadow" or the extra overhead added by the broker's spread.
Key Benefits for Traders
For a trader, this logic serves as a constant reminder of market friction. It helps in identifying:
- True Entry/Exit Limits: By seeing the spread-adjusted price, you can better understand where your order might actually be filled compared to what you see on a standard chart.
- Market Transparency: It provides a visual buffer that accounts for the cost of trading, helping to prevent "false" signals that might occur when looking at price action without considering the bid-ask gap.
- Dynamic Updating: The script automatically recalculates these values as the market moves, ensuring that you are always viewing current spread conditions in real-time.
/*-----------------------------+
|			       |
| Shared by www.Aptrafx.com    |
|			       |
+------------------------------*/

//+------------------------------------------------------------------+
//|                                                   Ask_Shadow.mq4 |
//|                              transport_david , David W Honeywell |
//|                                        transport.david@gmail.com |
//+------------------------------------------------------------------+
#property copyright "transport_david , David W Honeywell"
#property link      "transport.david@gmail.com"

#property indicator_chart_window
#property indicator_buffers 2
#property indicator_color1 Lime
#property indicator_color2 Lime
//---- input parameters

//---- buffers

double ExtMapBuffer1[];
double ExtMapBuffer2[];

//+------------------------------------------------------------------+
//| Custom indicator initialization function                         |
//+------------------------------------------------------------------+
int init()
  {
//---- indicators
   SetIndexStyle(0,DRAW_HISTOGRAM, 0, 1, Coral);
   SetIndexBuffer(0, ExtMapBuffer1);
   SetIndexStyle(1,DRAW_HISTOGRAM, 0, 1, Coral);
   SetIndexBuffer(1, ExtMapBuffer2);
//----
   return(0);
  }
//+------------------------------------------------------------------+
//| Custor indicator deinitialization function                       |
//+------------------------------------------------------------------+
int deinit()
  {
//----

//----
   return(0);
  }
//+------------------------------------------------------------------+
//| Custom indicator iteration function                              |
//+------------------------------------------------------------------+
int start()
  {
   double spread, Top, TopPlus;
   int counted_bars=IndicatorCounted();
   if  (counted_bars<0) return(-1);
   if  (counted_bars>0) counted_bars--;
   int i;
//----
   for (i=counted_bars-1; i>=0; i--)
     {
      spread=(Ask-Bid);
      TopPlus=(High[i]+spread);
      Top=(High[i]);
      ExtMapBuffer1[i]=TopPlus;
      ExtMapBuffer2[i]=Top;
      }

//----
   return(0);
  }
//+------------------------------------------------------------------+
Comments