ATR Levels custom
Download script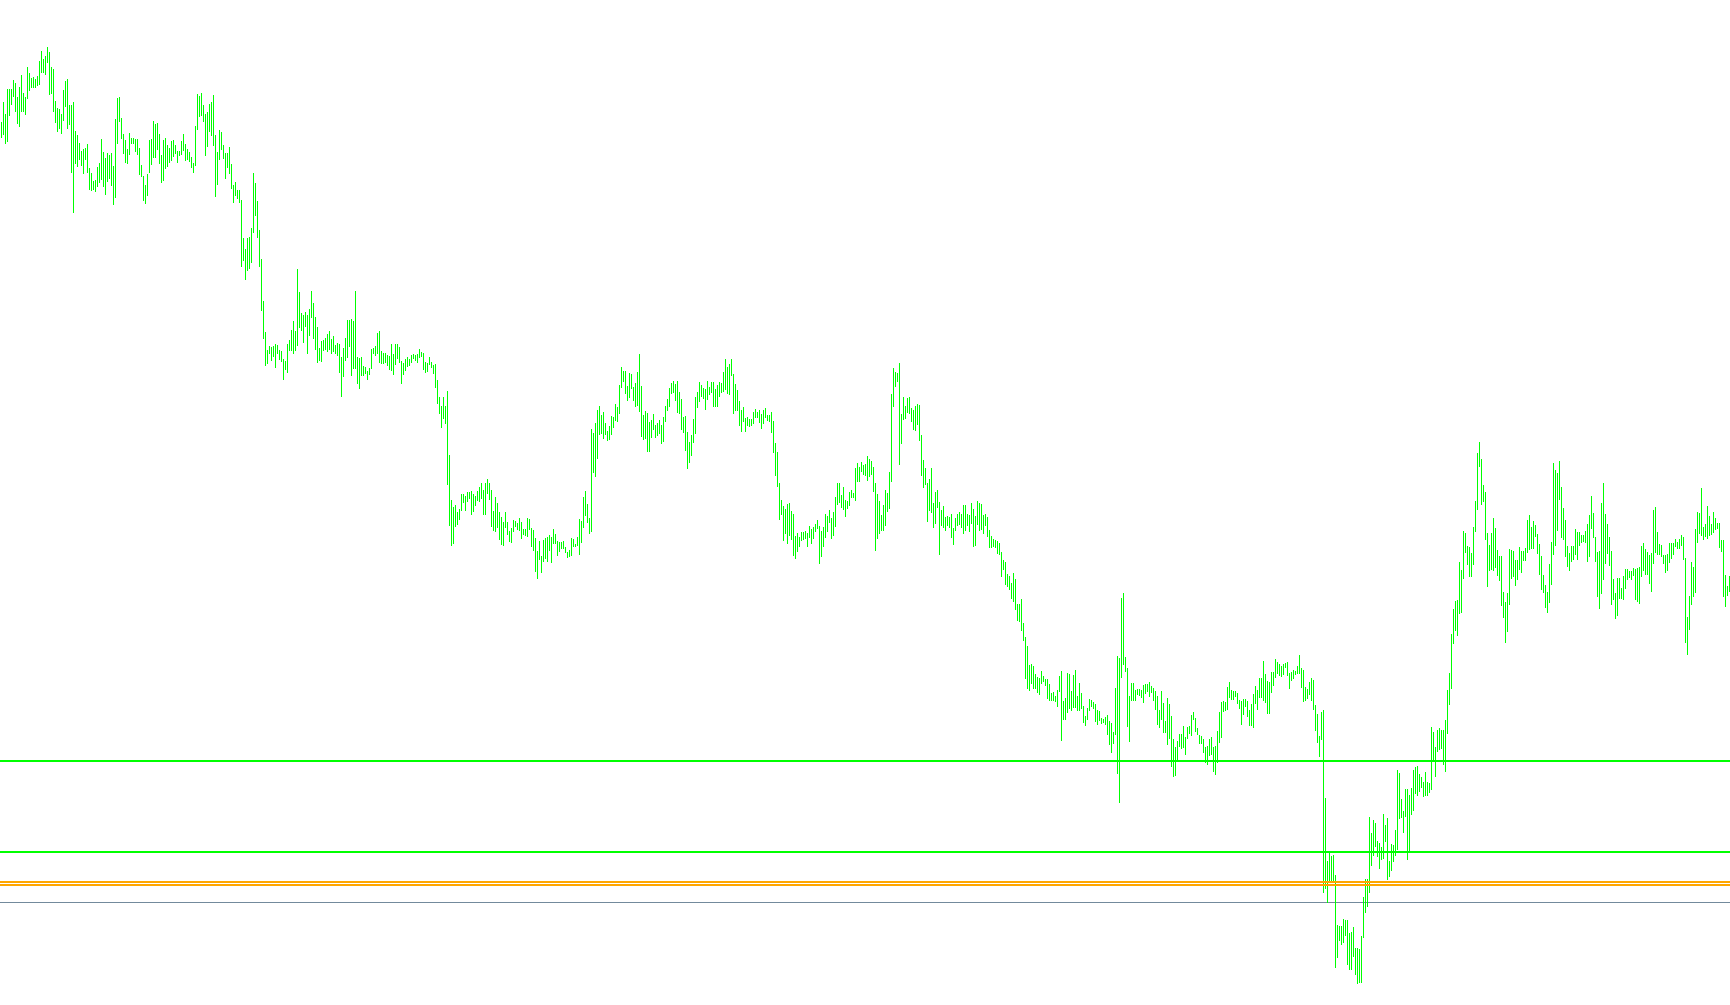
This tool is designed to provide traders with a visual representation of potential support and resistance levels based on market volatility. Rather than relying on static price history alone, it utilizes the Average True Range (ATR) to calculate dynamic zones that adjust to current market conditions.
Core Logic and Functionality
Volatility-Based Calculations The primary logic of the script revolves around the ATR, a standard technical indicator that measures how much an asset typically moves over a specific period. The tool calculates a "Full ATR" and a "Half ATR" value based on daily price data. These values serve as the building blocks for determining the distance of potential price boundaries.
Dynamic Support and Resistance Levels The script automatically identifies and plots several key horizontal lines on your chart:
- Yesterday’s Levels (Alpha): The tool looks at the previous day's high and low prices. It then projects "Alpha" resistance and support levels by adding or subtracting the ATR value from those historical points. This helps identify where price might react based on yesterday's established range combined with current volatility.
- Today’s Levels (Beta): Similarly, it calculates "Beta" levels using the current day's data. These lines act as real-time markers to show where support and resistance may form as the current trading session progresses.
Multi-Tiered Projections Beyond the primary boundaries, the logic establishes a hierarchy of secondary levels. By applying different multipliers of the ATR (such as 0.5x, 1.0x, and 1.5x), the script creates a tiered structure of "levels." This allows traders to see not just the most immediate area of interest, but also deeper zones of potential price rejection or acceleration.
Visual Presentation
To ensure clarity for the user, the script handles all visual elements automatically:
- Color Coding: It distinguishes between resistance (upper bounds) and support (lower bounds) using high-visibility colors (typically Lime for resistance and Orange for support).
- Real-Time Updating: The lines are programmed to move dynamically with the price. As new data comes in, the script recalculates the positions and updates the labels on the chart automatically.
- Automated Labeling: Each line is accompanied by a text label that displays the exact price coordinate. These labels also specify whether the level is an "Alpha" (based on yesterday) or "Beta" (based on today) reference point.
Technical Constraints
The script includes a built-in safety check to ensure it operates correctly across different timeframes. It is specifically optimized for intraday trading and will provide an error notification if applied to charts exceeding a one-day period, ensuring that the daily volatility data remains accurate and relevant to the visual output.
//+------------------------------------------------------------------+
//|                                                   ATR Levels.mq4 |
//|                                                    Mike Ischenko |
//|                                            mishanya_fx@yahoo.com |
//+------------------------------------------------------------------+
#property copyright "Mike Ischenko"
#property link      "mishanya_fx@yahoo.com"

#property indicator_chart_window


extern int ATRPeriod = 10;

double rates_d1[][6];
double H1, H2, H3, H4, H4t, H5, L5, L4, L4t, L3, L2, L1, halfatr, fullatr;
int timeshift=0, timeshifts=0, beginner=0;
int periods;

//+------------------------------------------------------------------+
//| Custom indicator initialization function                         |
//+------------------------------------------------------------------+
int init()
  {
//---- indicators
//----
   return(0);
  }
//+------------------------------------------------------------------+
//| Custor indicator deinitialization function                       |
//+------------------------------------------------------------------+
int deinit()
  {
//---- TODO: add your code here


   ObjectDelete("H4atr line");
   ObjectDelete("L4atr line");
   ObjectDelete("L4atr label");
   ObjectDelete("H4atr label");
   ObjectDelete("H4tatr line");
   ObjectDelete("L4tatr line");
   ObjectDelete("L4tatr label");
   ObjectDelete("H4tatr label");


//----
   return(0);
  }
//+------------------------------------------------------------------+
//| Custom indicator iteration function                              |
//+------------------------------------------------------------------+
int start()
  {
   int    counted_bars=IndicatorCounted();
   //if (counted_bars<1) return(0);


   switch (Period())
   {
      case PERIOD_M1:  {timeshifts=60; beginner=Hour()*60;} break;
      case PERIOD_M5:  {timeshifts=300; beginner=Hour()*12;} break;
      case PERIOD_M15: {timeshifts=900; beginner=Hour()*4;} break;
      case PERIOD_M30: {timeshifts=1800; beginner=Hour()*2;} break;
      case PERIOD_H1:  {timeshifts=3600; beginner=Hour()*1;} break;
      case PERIOD_H4:  {timeshifts=14400; beginner=Hour()*0.25;} break;
      case PERIOD_D1:  {timeshifts=86400; beginner=Hour()*0;} break;
    }

   timeshift=timeshifts*24;

   if(Period() > 86400)
      {
         Print("Error - Chart period is greater than 1 day.");
         return(-1); // then exit
      }


   ArrayCopyRates(rates_d1, Symbol(), PERIOD_D1);


   //beginner=Hour();

            fullatr = iATR(Symbol(), PERIOD_D1, ATRPeriod, 1);

            L4 = rates_d1[1][3] - fullatr;
            H4 = rates_d1[1][2] + fullatr;
            L4t = rates_d1[0][3] - fullatr;
            H4t = rates_d1[0][2] + fullatr;
            halfatr = fullatr * 0.5;

            H1 = H4+1.5*fullatr;
            H2 = H4+fullatr;
            H3 = H4+halfatr;
            L3 = L4-halfatr;
            L2 = L4-fullatr;
            L1 = L4-1.5*fullatr;


   if (ObjectFind("H4atr Line") != 0)
     {
      ObjectCreate("H4atr line",OBJ_HLINE,0,Time[0],H4);
      ObjectSet("H4atr line",OBJPROP_COLOR,Lime);
      ObjectSet("H4atr line",OBJPROP_WIDTH,2);
     }
     else
     {
     ObjectMove("H4atr line", 0,Time[0],H4);
     }


   if (ObjectFind("L4atr Line") != 0)
     {
      ObjectCreate("L4atr line",OBJ_HLINE,0,Time[0],L4);
      ObjectSet("L4atr line",OBJPROP_COLOR,Orange);
      ObjectSet("L4atr line",OBJPROP_WIDTH,2);
     }
     else
     {
     ObjectMove("L4atr line", 0,Time[0],L4);
     }

   if (ObjectFind("H4tatr Line") != 0)
     {
      ObjectCreate("H4tatr line",OBJ_HLINE,0,Time[0],H4t);
      ObjectSet("H4tatr line",OBJPROP_COLOR,Lime);
      ObjectSet("H4tatr line",OBJPROP_WIDTH,2);
     }
     else
     {
     ObjectMove("H4tatr line", 0,Time[0],H4t);
     }


   if (ObjectFind("L4tatr Line") != 0)
     {
      ObjectCreate("L4tatr line",OBJ_HLINE,0,Time[0],L4t);
      ObjectSet("L4tatr line",OBJPROP_COLOR,Orange);
      ObjectSet("L4tatr line",OBJPROP_WIDTH,2);
     }
     else
     {
     ObjectMove("L4tatr line", 0,Time[0],L4t);
     }

if(ObjectFind("H4atr label") != 0)
      {
      ObjectCreate("H4atr label", OBJ_TEXT, 0, Time[0]+timeshift, H4);
      ObjectSetText("H4atr label", "ATR(y)H alpha res: " + DoubleToStr(H4,4), 8, "Verdana", Lime);
      }
      else
      {
      ObjectMove("H4atr label", 0, Time[0]+timeshift, H4);
      }

if(ObjectFind("L4atr label") != 0)
      {
      ObjectCreate("L4atr label", OBJ_TEXT, 0, Time[0]+timeshift, L4);
      ObjectSetText("L4atr label", "ATR(y)L alpha sup: " + DoubleToStr(L4,4), 8, "Verdana", Orange);
      }
      else
      {
      ObjectMove("L4atr label", 0, Time[0]+timeshift, L4);
      }

if(ObjectFind("H4tatr label") != 0)
      {
      ObjectCreate("H4tatr label", OBJ_TEXT, 0, Time[0]+timeshift, H4t);
      ObjectSetText("H4tatr label", "ATR(t)H beta res: " + DoubleToStr(H4t,4), 8, "Verdana", Lime);
      }
      else
      {
      ObjectMove("H4tatr label", 0, Time[0]+timeshift, H4t);
      }

if(ObjectFind("L4tatr label") != 0)
      {
      ObjectCreate("L4tatr label", OBJ_TEXT, 0, Time[0]+timeshift, L4t);
      ObjectSetText("L4tatr label", "ATR(t)L beta sup: " + DoubleToStr(L4t,4), 8, "Verdana", Orange);
      }
      else
      {
      ObjectMove("L4tatr label", 0, Time[0]+timeshift, L4t);
      }

   return(0);
  }
//+------------------------------------------------------------------+
Comments